Bad Debt Reserve Calculation for Finance Leaders
Proper reserve calculations protect forecasts and creditor confidence when done rigorously.

Bad debt reserves aren't a rounding error tucked into a footnote. The method a finance team picks to calculate one, and how carefully they maintain it, says more about the health of the AR function than almost any other single number on the balance sheet. Get the reserve wrong and everything downstream, forecasts, covenant compliance, investor confidence, gets a little wobbly.
The size of the bad debt problem and the case for rigor in reserve-setting
Unpaid invoices touch 56% of small businesses, with the average company sitting on $17,500 it's owed but hasn't collected.
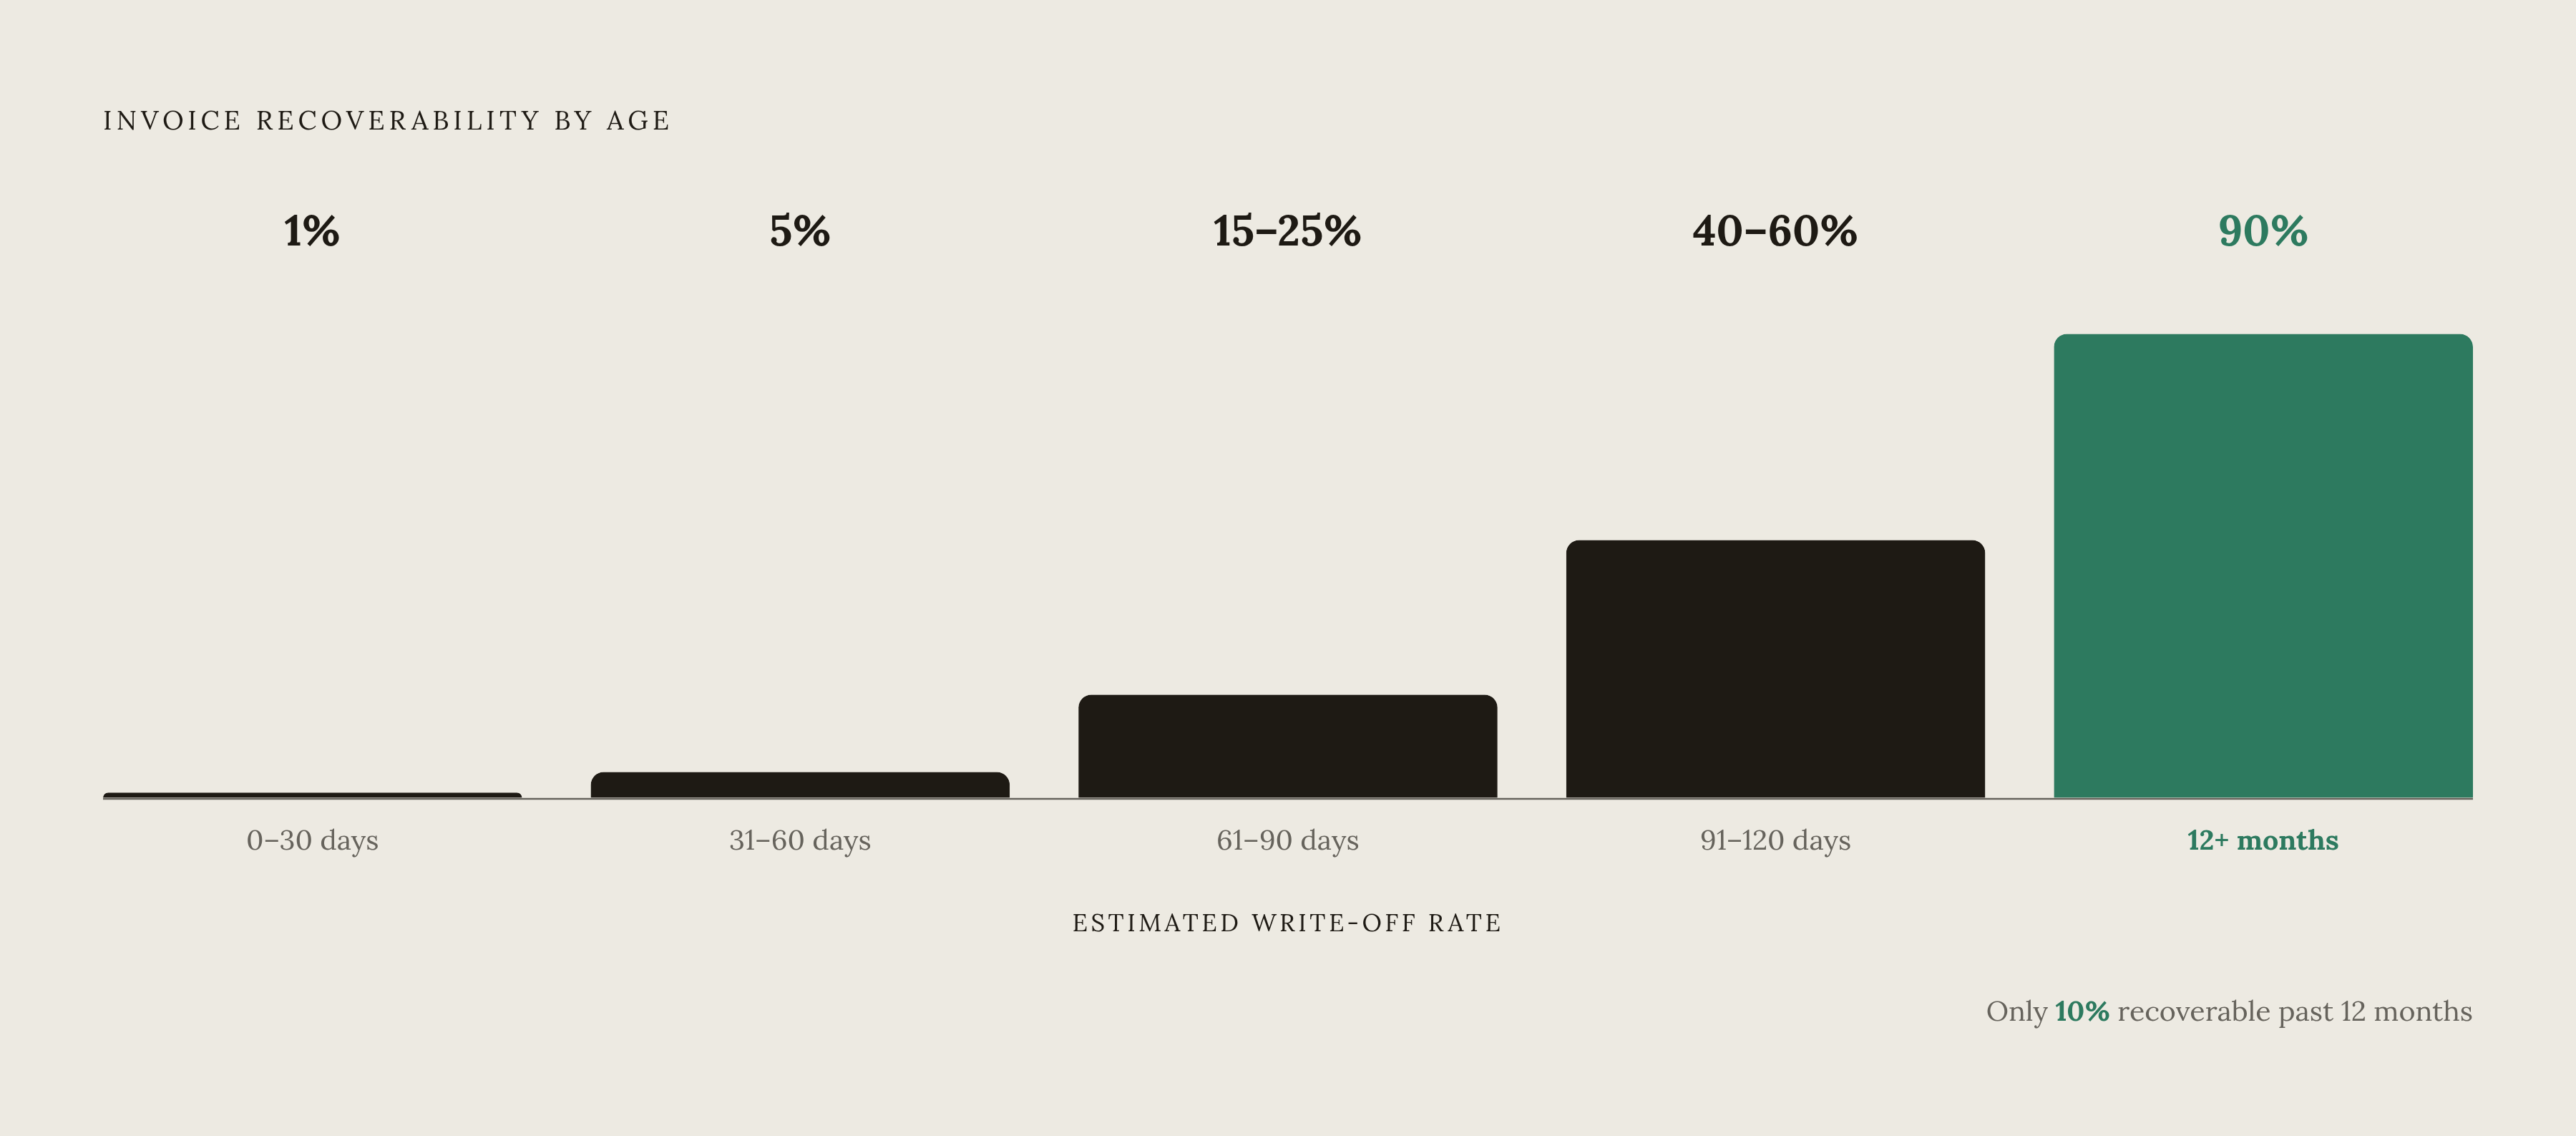
Atradius data shows bad debts make up roughly 9% of all B2B sales. Nine cents on every dollar of business-to-business revenue, gone before it ever hits the bank. And time is not on the creditor's side here. Once an invoice passes the 12-month mark, only about 10% of it is still recoverable. Which means a reserve built on last year's assumptions and left untouched is quietly lying to whoever reads the balance sheet.
The consequences aren't just theoretical. 42% of finance leaders say rising bad debt write-offs are hurting their ability to forecast accurately. That's the real cost: not the write-off itself, but the fact that leadership stops trusting its own numbers.
The two accounting methods and when each applies
There are two ways to account for bad debt, and they are not interchangeable, they're parallel obligations that serve different masters.
Direct write-off method waits. It records bad debt expense only once a specific invoice is confirmed dead, debiting Bad Debt Expense and crediting Accounts Receivable. Simple to execute, and fine if a company has almost no bad debt to speak of. But it breaks the GAAP matching principle, because the expense can be in a completely different period than the sale that created it. That mismatch is why the direct write-off method is the one required for federal income tax purposes. federal income tax purposes: a debt is only deductible in the year it becomes worthless, and that worthlessness has to be documented before the return goes in. Partial write-offs are allowed, but the deduction can't exceed what's actually been charged off on the books.
Allowance method is the GAAP-compliant approach, and it works in reverse: estimate the uncollectible amount ahead of time, at the end of each period, and set the reserve up in advance. It runs on two separate journal entries, one to establish or adjust the reserve, and a second one later to write off a specific invoice against that reserve once it's confirmed dead. That second entry never touches the income statement, because the expense was already recognized when the reserve went up. That's the matching principle doing what it's supposed to do. Any company with material bad debt has to use this method for GAAP reporting.
So the practical rule: Accrual-basis companies with meaningful receivables need the allowance method for their financial statements and the direct write-off method for their tax return. Same debt, two books, two different logics.
Five methods for estimating the reserve, ordered from simplest to most defensible
Choosing a method isn't a coin flip. It should match the company's data quality, its customer mix, and how much scrutiny the number will face from an auditor.
Method 1: Percentage of credit sales takes the historical average bad debt, divides it by historical average credit sales, and applies that percentage to the current period's credit sales. A company with a substantial book of invoices and a historical 5% bad debt rate books a reserve equal to that percentage of the total. Good for high-volume businesses with a fairly uniform customer base, where reviewing accounts one by one isn't realistic. The weakness: it applies one flat rate no matter how old any given invoice is, so a portfolio quietly aging into default looks the same on paper as a healthy one.
Method 2: Percentage of accounts receivable. Same idea, different denominator: apply a fixed loss percentage to the total AR balance rather than to sales. A 2% loss assumption on the AR balance produces a reserve equal to 2% of that number. It's a balance-sheet view rather than an income-statement view, and it's more current than the sales-based method since it's tied to what's actually outstanding right now. Benchmarks vary quite a bit by industry: retail is around 1%-2%, manufacturing 2%-4%, healthcare 3%-6%, SaaS and technology 2%-5%, financial services 1%-3%.
Method 3: Accounts receivable aging schedule. This is the one most companies with real AR balances end up using, because it doesn't pretend every dollar of receivables carries the same risk. Invoices get sorted into buckets by days outstanding, and each bucket gets an escalating default rate: something like 1% for 0-30 days, 5% for 31-60 days, and escalating rates for older buckets beyond that. That escalation isn't arbitrary. Write-off rates jump to 15%-25% at the 90-day mark, and then to 40%-60% once an invoice passes 120 days. The output is a simple table: bucket, balance, rate, estimated loss. Adding up that last column gives the reserve.
The regulatory context finance leaders must track: CECL and ASU 2025-05
CECL (Current Expected Credit Losses) changed the game when it required companies to recognize estimated credit losses immediately over the full remaining life of a financial asset, a real break from the old incurred-loss model, which only booked a loss once it had actually happened.
Private companies pushed back hard on one particular consequence: forecasting things like future unemployment rates over the life of a trade receivable that might be paid off in 30 days felt absurd. Forecasting the economy to estimate the risk on an invoice that'll be settled before next month's rent is due is a bit like hiring a weather forecaster to tell you if your ice cube will melt.
That complaint produced ASU 2025-05, arguably the most consequential CECL update since the standard was first adopted. It gives every entity, private companies and not-for-profits included, a practical expedient for estimating expected credit losses on current receivables and ASC 606 contract assets: instead of forecasting future economic conditions, a company can just assume today's conditions hold for the life of the asset. Private companies (not public business entities) get an extra option on top of that: they can factor in collections received after the balance sheet date but before the financial statements are actually issued. A company that collects most of its receivables before it publishes its statements doesn't have to hold a credit loss allowance against money it's already banked.
The new rule takes effect for annual periods beginning after December 15, 2025, with early adoption allowed. IFRS doesn't offer this same expedient. Any company reporting under both frameworks, or migrating between them, now has a real divergence to track.
What industry benchmarks reveal about AR function quality
Benchmarks for the allowance for doubtful accounts range from 1% to 5% of total AR depending on the industry, and that spread is itself the lesson: there's no single "normal" number that applies across the board. A SaaS company and a manufacturer are not playing the same game.
For a broader anchor point, S&P 500 companies averaged a bad debt expense of 1.2% of AR in 2023. That's a useful floor for a public-company CFO wondering where they stand.
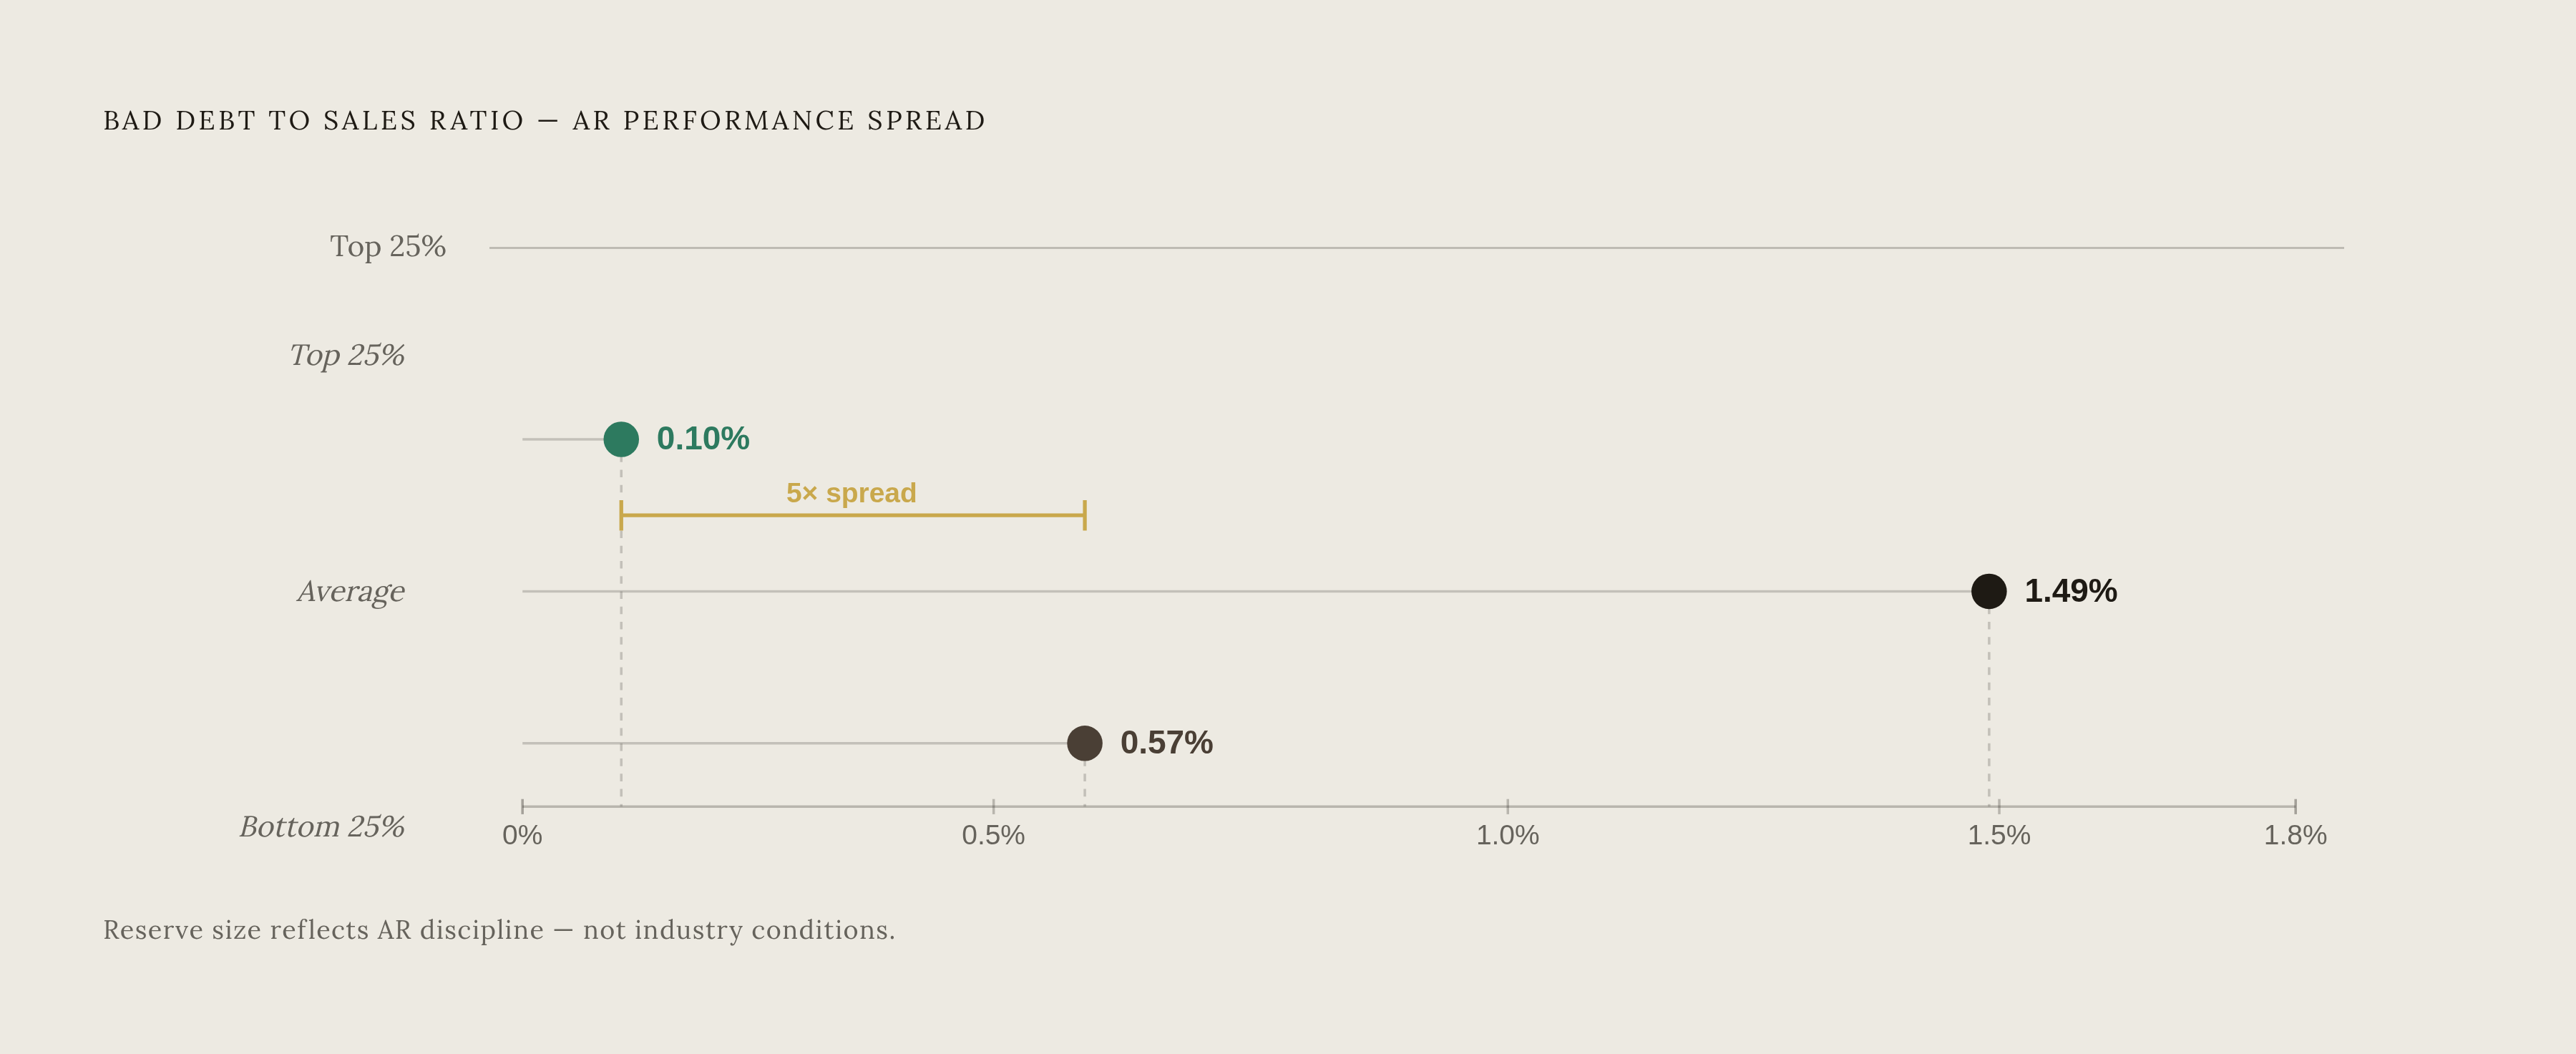
The more revealing split is visible inside the performance data, not between industries. Companies in the top 75th percentile kept their bad debt-to-sales ratio at 0.1% or lower. The bottom 25th percentile ran 0.57% or worse. The average across the group landed at 1.49%. That's a gap of more than five times between the best-run AR functions and the worst, inside the same set of companies, facing the same macro conditions. Reserve size, in other words, reflects how well AR is managed. It's a scorecard for how well AR is actually being managed.
Globally, Atradius puts the B2B write-off rate at around 2% of total receivables, with some recent regional surveys showing closer to 5% of receivables value eventually written off.
How the reserve calculation connects to upstream AR operations
None of these five methods conjure numbers out of thin air. Every one of them runs on the accuracy of the aging data feeding it, and aging data is only as good as the operational process that produces it.
Consider what actually inflates an aging bucket without any real change in credit risk. An invoice stuck inside a supplier portal, say Coupa or Ariba, waiting on approval, is just stuck. It has simply stalled there, with no real change in credit risk behind it. But the aging schedule ages an invoice stuck in a portal the same way it ages one where the customer is refusing to pay, so it eventually lands in a high-risk bucket it doesn't belong in.
Missing paperwork does the same damage. A vendor tax form that never got filed, a PO number that never got matched, a compliance certificate sitting in someone's inbox, all of it delays payment and pushes a perfectly collectible invoice deeper into the aging schedule. The reserve methodology then slaps a higher default rate on what is, at bottom, a paperwork problem wearing a credit-risk costume.
Then there's the plainest failure of all: a customer who never got the invoice, or got it and forgot about it. No dispute, no missing document, just silence. The reserve books a potential loss that a single follow-up email might have prevented.
The pattern across all three is the same. Reserve accuracy is a downstream reflection of upstream discipline. Companies with tighter, more persistent follow-up processes tend to post reserve ratios that beat their sector benchmarks because fewer of their invoices get lost in the machinery long enough to look uncollectible.