Building an AR Aging Report That Surfaces Risk Early
Rethink aging reports to flag payment trouble at 30 days, not 90.

Late payment isn't the exception in B2B collections anymore, it's the baseline. And that means the standard AR aging report, the one grouping invoices into 30, 60, 90-day buckets, is mostly telling you what already went wrong instead of what's about to. This piece walks through how to rebuild that report so it catches trouble at 30 days instead of confirming it at 90.
Quick definition, since it matters for everything after: an aging report is a snapshot of unpaid invoices sorted by how long they've sat unpaid, grouped into buckets. Standard structure runs Current, 1-30, 31-60, 61-90, and 90+ days past due, with some finance teams splitting that last bucket into 91-120 and 120+ for more resolution. Simple enough on paper.
Most teams get wrong whether to age from the invoice date or the due date. Aging from the invoice date is the more common mistake, and it quietly wrecks the whole report for any customer on Net 60 or Net 90 terms, because it makes them look overdue when they're actually right on schedule. Aging from the due date is the correct method. It reflects what you actually agreed to get paid, not just how much time has passed since you sent the bill. Get this wrong and every bucket above it is measuring the wrong thing.
Most finance teams use the aging report to prioritize who to call, estimate bad debt reserves, and shape credit policy for new customers. Fair enough, that's the textbook use case. But the report has a built-in blind spot: it's a record of what already happened. By the time an invoice shows up in the 60-day bucket, the actual moment the customer decided (or was forced) to stop paying you happened weeks earlier. The report is a rearview mirror bolted onto a car that needs a windshield. Fixing that requires rethinking what you build into the report from the start, and that's what the rest of this piece covers.
Why late payment is the default, not the exception
Getting paid on time is now the outlier, not the norm. Recent data puts 92% of businesses getting paid after their invoice due date, up from 87% just a couple years prior. That's not a rounding error, that's a trend line pointing the wrong direction fast.
The 2025 numbers back it up from another angle: roughly 40% of invoices went overdue that year, the highest overdue rate in five years running. On the small business side, 56% of businesses in one region small businesses report invoices overdue by more than 30 days, and the average overdue balance sits around $17,500 each. That's real money sitting in limbo, multiplied across a whole customer list.
Zoom out to the portfolio level and it gets worse. Over 70% of companies report Days Sales Outstanding (DSO) above 46 days, and 63% say their DSO is actively climbing, not holding steady. Across the companies surveyed, that adds up to $707 billion trapped in working capital, doing nothing, earning nothing, just parked in accounts receivable instead of funding payroll or growth.
Context matters here too, because "45 days DSO" means something completely different depending on the industry. Retail typically runs 5 to 20 days. Professional services land around 30 to 60. Manufacturing sits at 45 to 60. Construction stretches to 60, sometimes 90-plus, because payment often waits on project milestones. So before panicking over your own aging report, check it against what's normal for the sector. The bigger point stands regardless: late payment is structural now, not some rare misbehavior from a handful of problem accounts. Your aging report isn't hunting for outliers anymore. It's tracking a near-universal pattern, and that changes how seriously it needs to be built.
The collection probability cliff that makes timing everything
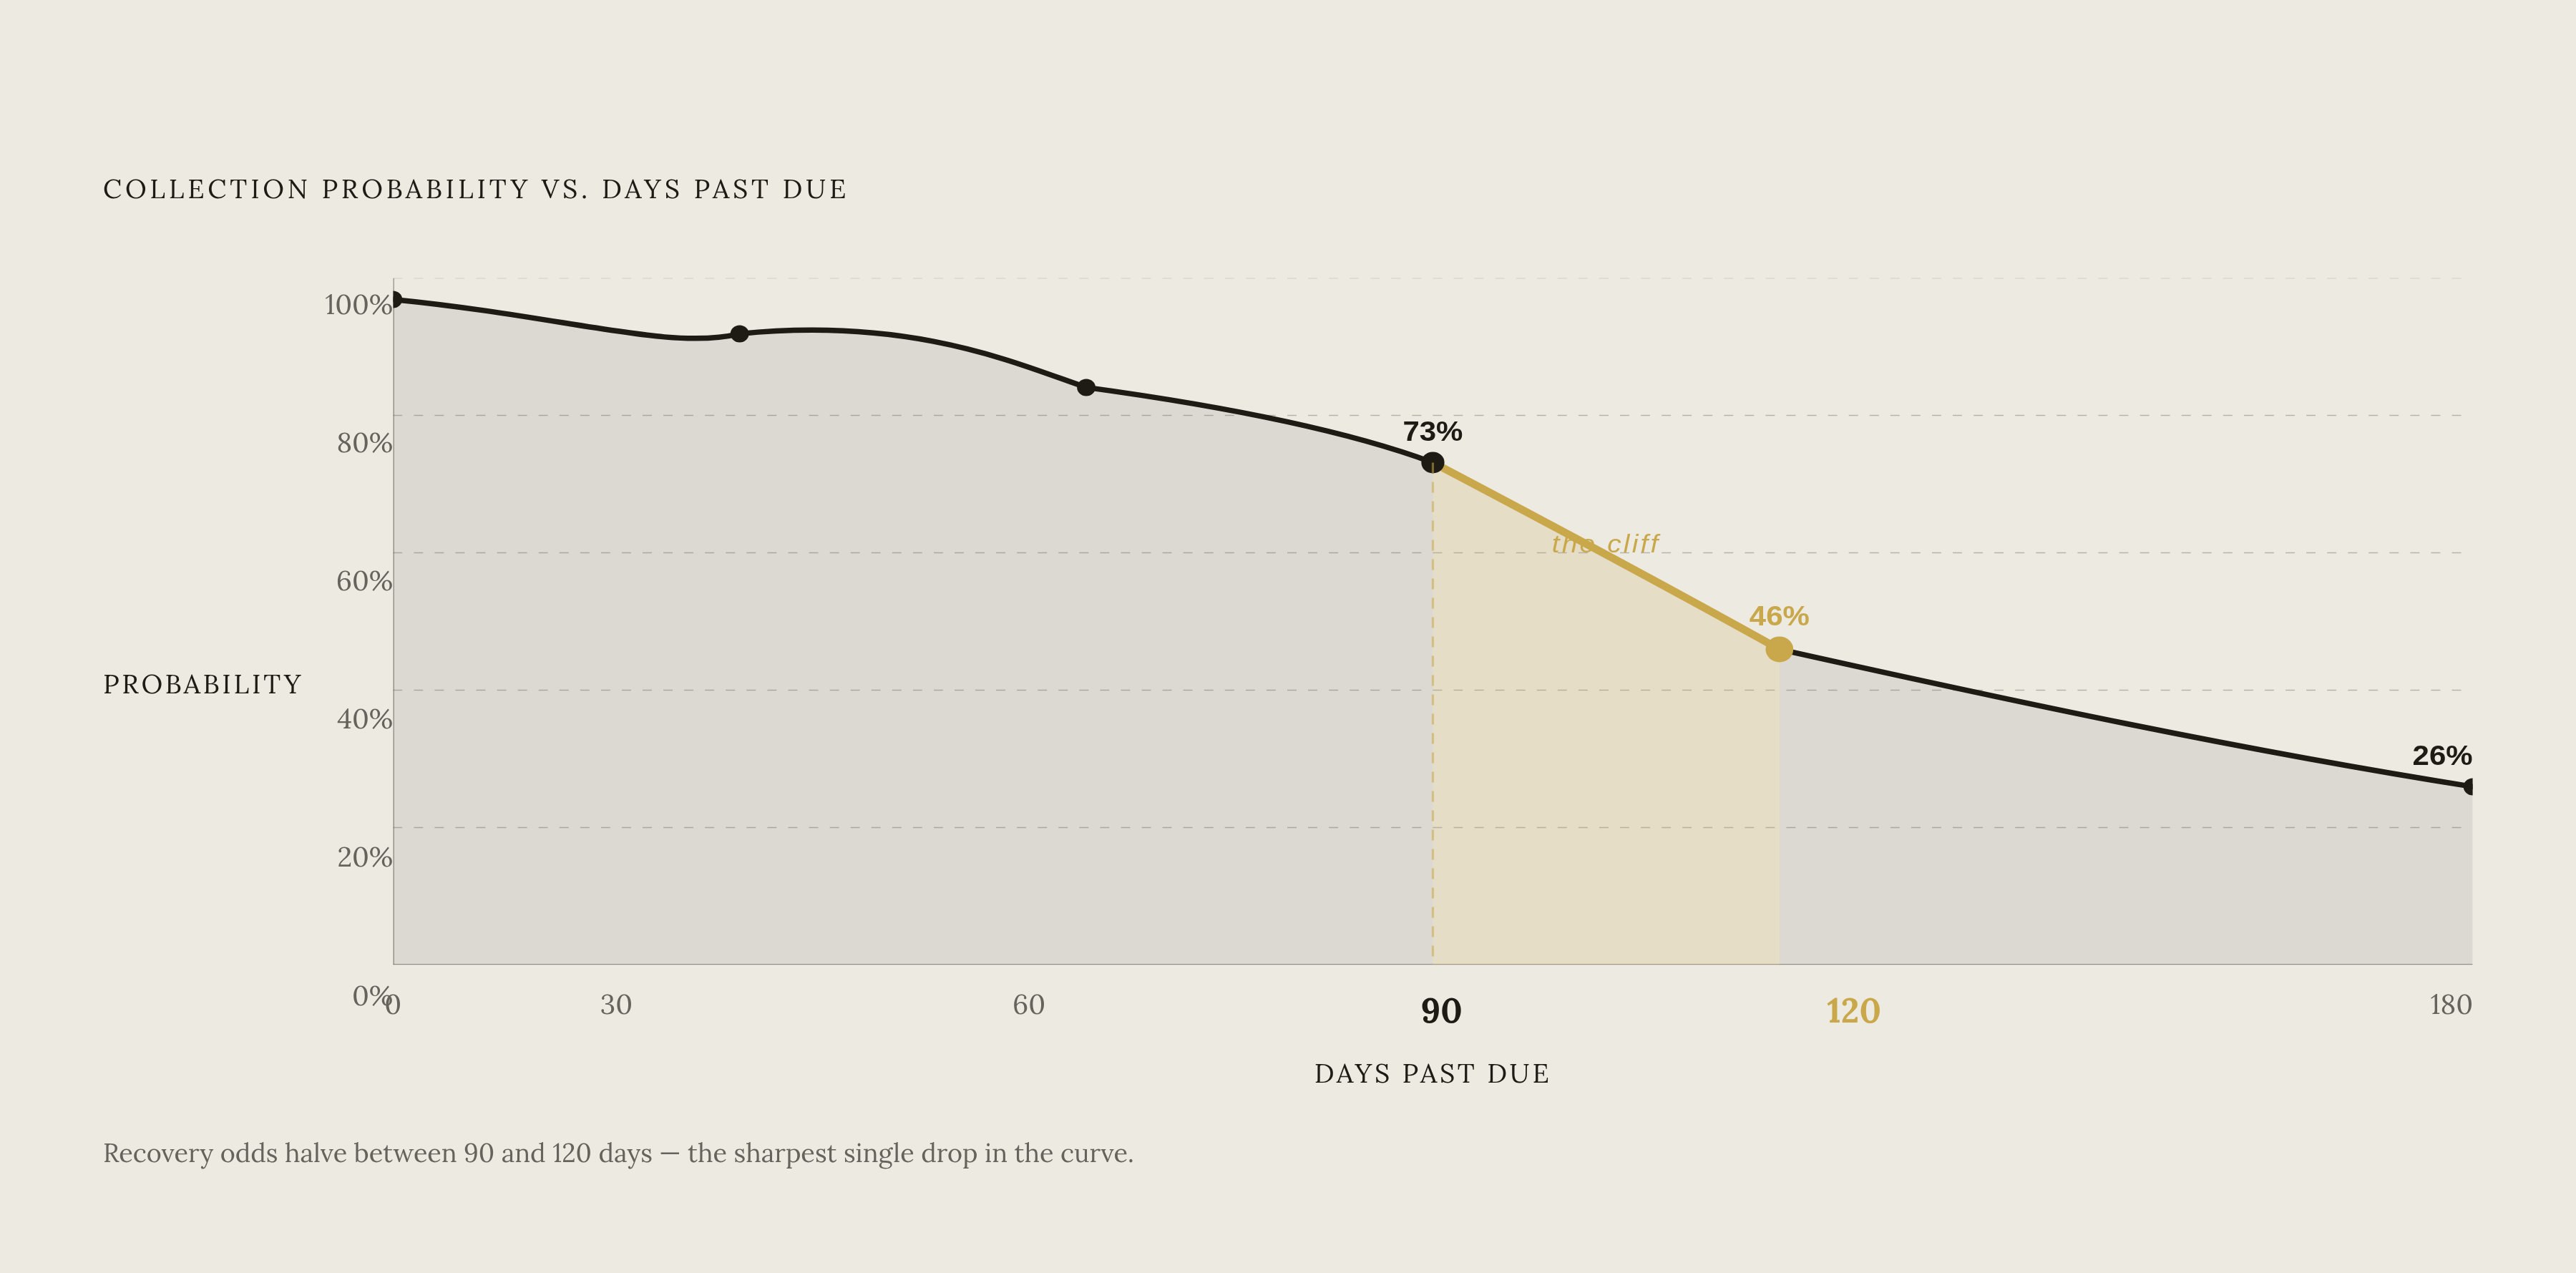
The odds of collecting on an account drop to around 73% after 90 days, and fall below 50% after six months. That's not a gentle slope. That's a cliff, and most of the descent happens faster than people expect.
Recovery rates hold up reasonably well through 90 days, then fall sharply, and the drop-off past 120 days is closer to a wall than a slope. The real insight hiding in that pattern: the receivables that eventually get written off at 120 days are disproportionately the ones that stopped getting any real follow-up back at 60 days. The window where money is actually recoverable runs from roughly 90 to 180 days, and after that, it's mostly wishful thinking dressed up as a collections effort.
Industry data confirms plenty of companies are already living past that cliff. In one recent quarterly report, 16 out of 203 tracked industry segments showed 10% or more of their AR dollars sitting at 91-plus days past due, up from 18 segments the quarter before. Certain sectors, manufacturing, technology and electronics, business and professional services, show especially rough numbers. Miscellaneous fabricated wire products, for instance, had 31.0% of AR dollars stuck at 91-plus days late. Telephone communications sat at 23.6%. Those aren't rounding errors, those are entire product lines financed on unpaid promises.
Structurally, this means any report that only flags accounts once they hit the 90-day bucket is already too late for a meaningful chunk of that money. The real design question isn't "how do we chase 90-day accounts harder." It's how to catch risk while it's still sitting at 30 or 60 days, back when a phone call actually moves the needle. And the stakes compound quietly: bad debt write-offs average just 1 to 3% of revenue across most industries, a small number that turns into a genuinely large one once it's multiplied across an entire year of sales.
How to read each aging bucket as a distinct risk signal, not just a time label
Treat each bucket as its own diagnostic test, not just a slice of a calendar.
Current, meaning 0-30 days, is a health check, not a warning zone. A low balance here reflects solid credit decisions upfront and invoices going out clean and on time. The real value, though, is watching invoices as they approach the 30-day mark, before they cross over. Best practice says reach out before the invoice technically flips into the next bucket, not after. Waiting for the bucket to change before acting is like waiting for the smoke alarm to go off before checking if the stove's on.
31-60 days is the bucket that actually deserves the most attention, and it's the one most finance teams walk right past. Most companies treat 90 days as the trigger for serious concern. By then, honestly, the conversation should've already happened weeks ago. Watch the trend here specifically: if this bucket climbs from 8% to 14% of total AR over two quarters, that's not noise, that's a collections process quietly breaking down in real time. This is also where intervention costs the least and works the best, which makes it the single highest-leverage bucket in the whole report.
61-90 days is where things get serious. Global B2B payment terms now average 55-plus days, and 64% of small businesses report invoices sitting 60-plus days past due. A customer's sudden jump from current to 60-plus days often signals actual financial trouble underneath, not just a slow accounting department.
90-plus days is bad debt territory, not a to-do list. Collection odds have already fallen to around 73% by this point, and whatever meaningful action was going to work should've happened before the account got here. Standard practice considers write-off somewhere around 120 to 180 days past due, once normal collection steps have been exhausted. At this stage, the bucket's real remaining job is feeding credit-loss estimates and informing whether credit policy needs to change going forward.
DSO alone can mislead you. Two companies can post the exact same 45-day DSO and have completely different aging profiles underneath it, one steady and boring, the other a mess held together by a few big, slow payers. The aging report shows what the DSO number quietly papers over.
Portfolio-level signals that a single customer's row won't show you
Individual account rows tell part of the story. The portfolio view tells the rest, and it's usually the more alarming part.
Start with a basic threshold question: how much past-due AR is too much? If more than 20 to 25% of total AR sits past due, that's a threshold that warrants a closer look at how collections is functioning overall. For B2B SaaS companies billing monthly, that threshold drops lower, around 15% overdue should trigger a review. And if 40% of receivables are sitting older than 60 days, that's a preemptive signal to brace for a cash crunch next cycle and delay any spending that can wait before the squeeze actually hits.
Customer concentration is arguably the sneakiest risk in the whole report. If one customer makes up more than 15 to 20% of total receivables, the company's cash flow is now hostage to that one relationship's payment habits, whether anyone planned it that way or not. One large, slow-paying customer can drag the whole portfolio average down and make everything look worse than it is, or, just as dangerous, mask real deterioration everywhere else behind an otherwise decent-looking number.
Trends matter more than any single snapshot. A customer parked at a steady 45 days looks stable on paper, until a trend line reveals they've been sliding a little further out every quarter. Sudden shifts, current to 60-plus days practically overnight, deserve immediate attention, since that kind of jump usually points to financial distress rather than someone simply forgetting to pay a bill.
Seasonal patterns need context too. Certain customer segments follow predictable seasonal payment rhythms tied to their own business cycles. Neither is a red flag on its own, but a report that doesn't account for seasonal rhythm will cry wolf constantly. All of these signals ultimately feed cash flow forecasting: budgeting operating expenses, sizing up short-term borrowing needs, and timing capital spending around what's actually likely to come in the door.
Red flags the aging buckets won't surface on their own
The aging report only knows what already happened. It can't see trouble coming, it can only confirm trouble arrived. By the time a customer's balance shows up aging badly, their underlying problems might be months old already.
A few external signals tend to show up before the aging buckets do. Signs that a normally reliable customer is experiencing broader financial stress can be an early warning that payment trouble may be coming your way. Deteriorating financial fundamentals at a customer can surface before an invoice actually goes late, if anyone thinks to look. Public records of creditor actions against a customer's assets can be another tell that financial distress is already in motion.
Then there's the mess that lives inside your own books. Uncollectible accounts that never get formally written off distort the whole aging picture and waste collections effort chasing money that was never coming back anyway. Disputed invoices that don't get tagged separately create the same problem in a different flavor, genuine billing disputes sitting shoulder to shoulder with actually overdue balances, confusing collections priorities.
And then there's lapping, which sounds almost quaint until you realize what it actually is: an employee steals a payment from Customer A, then covers the gap by applying Customer B's payment to Customer A's account, and keeps that shell game running indefinitely. The aging report shows old balances creeping up and up. What it doesn't show is that the cause isn't customer behavior at all, it's internal theft wearing a disguise. Point being, an early-warning system needs more than invoice age as its input. It needs some basic integrity checks too, or the report ends up reflecting fiction instead of fact.
The structural choices that turn a standard aging report into an early-warning tool
A handful of structural decisions separate a report that just documents the past from one that actually flags trouble early.
Frequency comes first. Weekly review beats monthly, full stop. Monthly works fine as a bare minimum for closing the books, but weekly turns the aging report from a compliance formality into something people actually use to run the business day to day. Companies with high invoice volume or short payment terms benefit from weekly review most of all.
Aging from the due date, not the invoice date, remains the non-negotiable baseline. Skip this and every Net 60 or Net 90 customer gets misclassified before the report even starts. Add a "Current, approaching due" sub-view too, tracking invoices sitting 15 days out from their due date, so outreach can happen before anything actually ages into overdue territory.
Tag disputed invoices separately from genuinely overdue ones. Mixing the two corrupts prioritization, since collections staff waste time chasing disputes that need a different kind of resolution entirely. Add a customer concentration column showing each customer's share of total AR, flagging anyone crossing that 15 to 20% threshold. Layer in a trend view too, tracking each bucket's share of total AR against the prior period, since a jump from 8% to 14% in the 31-60 bucket is the actual signal, not whatever the raw dollar total happens to be that week.
Segment by customer type or payment terms, because a construction client and a SaaS client shouldn't get judged against the same yardstick. And build an executive dashboard that distills all of this into a handful of portfolio-level numbers, total by bucket, collection effectiveness trend, percent past due, without burying leadership in row-by-row detail they don't need to make strategic calls.
Since 2023, private companies following GAAP have had to estimate credit-loss allowances under the CECL standard, using historical default patterns to back into those numbers. The aging report's bucket history is exactly the data CECL estimates run on. That means this report isn't just an operational tool anymore, it doubles as an input into the financial statements themselves.
A tiered action protocol tied to what each aging stage actually requires
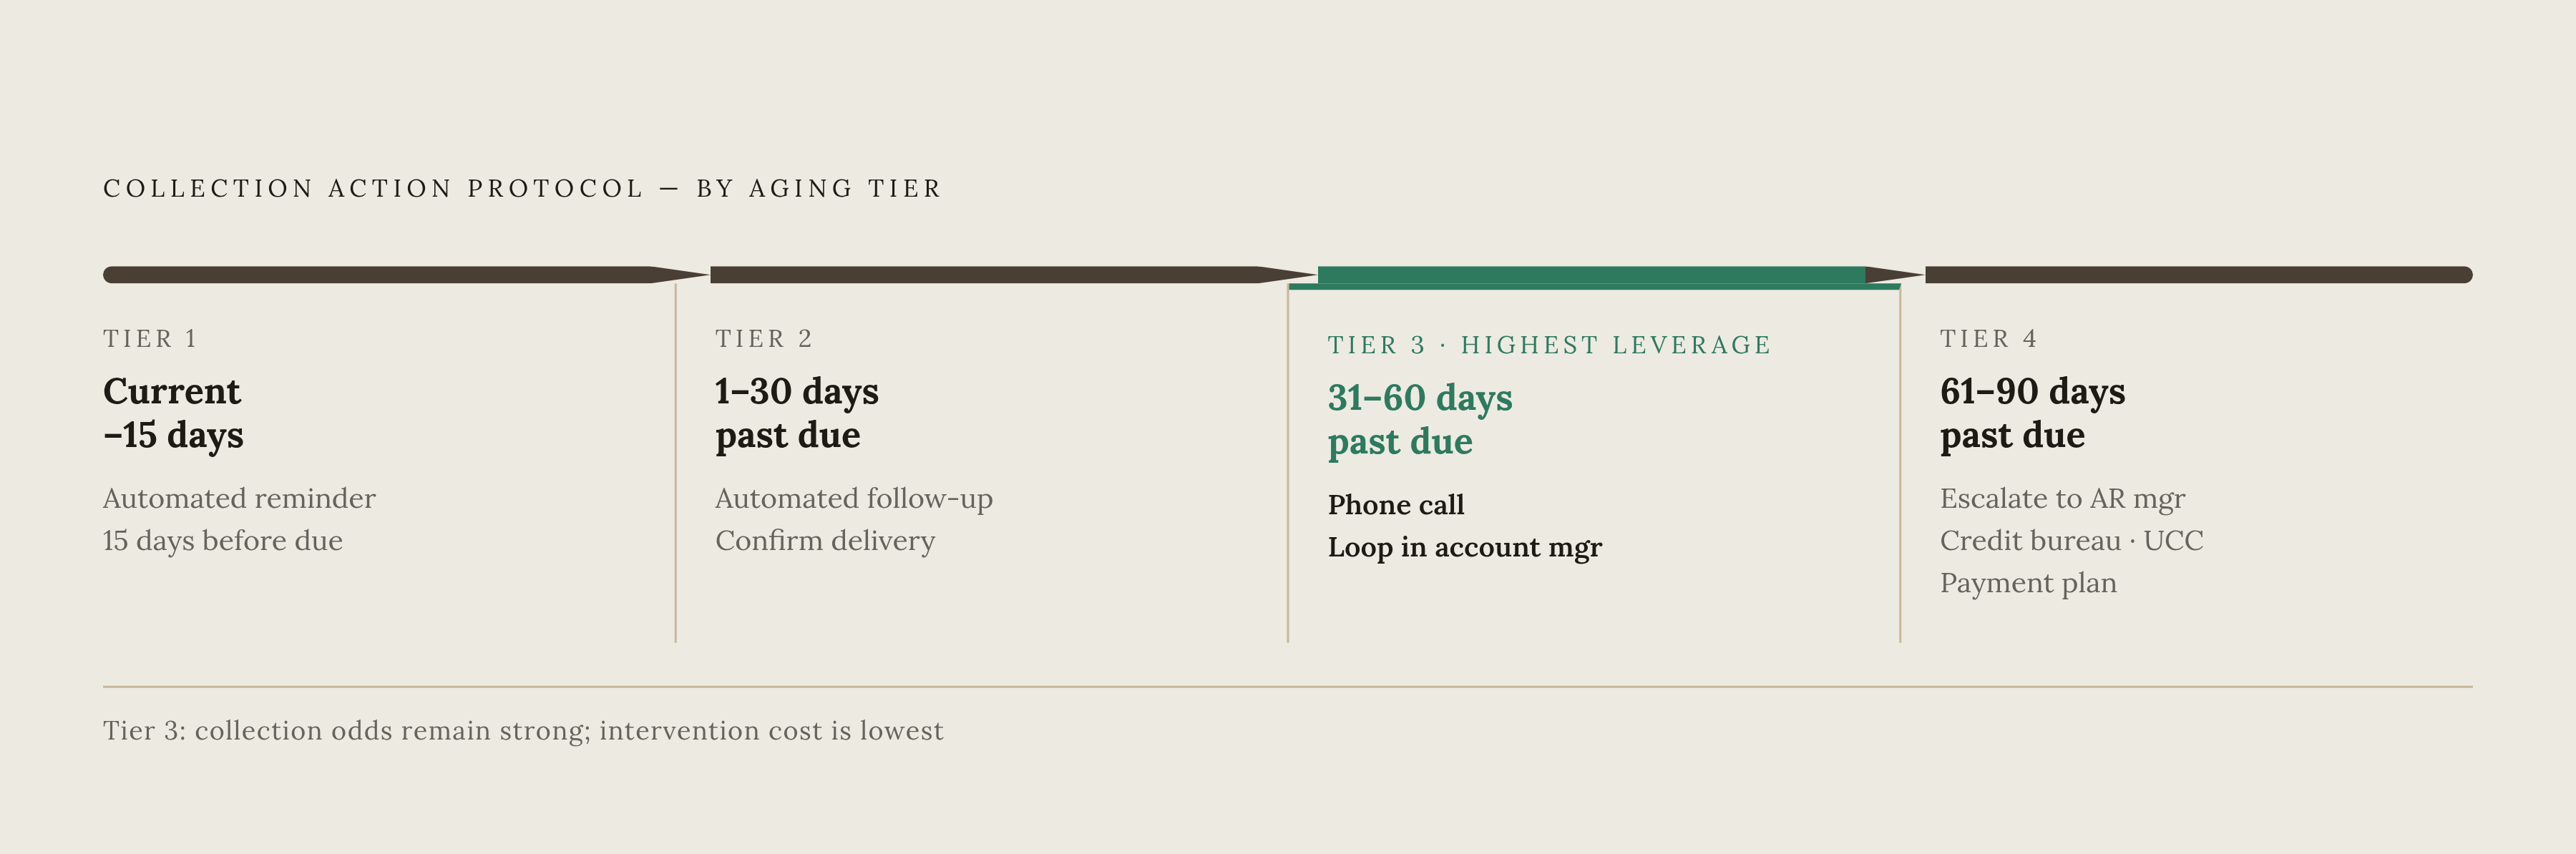
None of this matters without a plan attached to it. An aging report with no response protocol wired into it is just an observation deck, not an early-warning system. Define what happens at each stage before the report runs, not after someone notices a number looks bad.
Tier 1, current approaching due, means sending an automated reminder around 15 days before the due date, or right at it. Goal here is simple, keep the invoice from ever crossing into overdue territory in the first place.
Tier 2, 1-30 days past due, is when an automated follow-up goes out, and someone checks whether the invoice actually reached the customer or got stuck somewhere in a supplier portal. Missing tax forms, portal friction on platforms like certain vendor systems, unresolved disputes, these unglamorous administrative snags cause more "late payments" than actual unwillingness to pay. Rule these out before assuming the customer's just being slow on purpose.
Tier 3, 31-60 days past due, calls for picking up the phone. Email alone doesn't cut it here, and looping in the account manager on the call matters too. This is the tier that carries the most weight in the entire protocol, because collection odds are still strong, the cost of reaching out is low, and this is genuinely where the recoverable money still lives.
Tier 4, 61-90 days past due, calls for escalating to the AR manager, and if the account represents serious customer concentration, getting a senior relationship contact involved directly. Pull in outside signals too, check credit bureau payment behavior, look for any UCC filings that might've shown up. And weigh honestly whether a payment plan or partial settlement actually preserves more value than continuing to chase the full balance through standard channels. Sometimes getting most of the money now beats holding out for all of it never.