Calculating Days Sales Outstanding Correctly for SaaS and Services
Cash accounting method and payment terms matter more than the simple formula suggests.

DSO tells you how long cash sits in accounts receivable before it lands in the bank. The formula looks simple: divide AR by net credit sales, multiply by the number of days. But for SaaS and services companies, that simplicity is a trap. Bookings, billings, and recognized revenue are three different numbers that measure three different moments, and picking the wrong one gives a DSO figure that's confidently wrong rather than usefully right.
The denominator problem: why bookings, billings, and recognized revenue produce three different DSO numbers
Start with what each number actually represents, because they're not interchangeable, even though finance teams sometimes treat them that way.
Bookings are the value of a signed contract. Nothing has happened yet economically; it's a promise, not a transaction. Billings are what gets invoiced, the amount the customer actually owes right now. On a three-year contract billed annually, billings equal one year of the deal, not the full three. Under ASC 606, recognized revenue accrues most slowly of the three, appearing only as the work gets done. It accrues as the work gets done. A 12-month subscription recognizes one-twelfth of the contract value each month, regardless of when the invoice went out or when the cash came in.
So which one belongs in the DSO denominator? That's not a style preference, it's a contract question. The general guidance for contracts with no right of return, refund, or cancellation is to use billings for the period; where such clauses exist, GAAP recognized revenue is typically used instead. Get this backwards on an annual subscription and the math turns ugly fast: revenue trickles out over 12 months while the invoice went out for the whole year upfront. Divide AR by that thin monthly revenue slice, and DSO balloons, making collections look broken when the actual invoicing and collection process is fine.
Deferred revenue muddies things further. When a customer pays upfront, that cash is on the balance sheet as deferred revenue, not recognized revenue. An SEC correspondence filing documented this treatment as customary among at least two companies (Primedica Corporation and Inveresk Research Group) and their competitor Covance, adjusting for deferred revenue to capture the full collection cycle rather than just the recognized slice. The bigger operational lesson: whatever denominator gets chosen, stick with it. Switching between bookings, billings, and revenue quarter to quarter doesn't just create noise, it makes trend lines meaningless. You can't tell if collections improved or if you just changed the ruler.
How billing model determines what a "normal" DSO even looks like in SaaS
Ask a SaaS finance lead what "good DSO" looks like, and the honest answer is: it depends entirely on how customers pay. There are really two payment rails here, and they behave nothing alike.
Automated card billing, common in B2C and much of SMB SaaS, produces DSO that's basically zero. The card charges, the money lands, renewal happens the same way next cycle. There's no lag to measure unless the card gets declined. Manual invoicing for larger enterprise deals is a different animal entirely. Net 15 to 30 is typical for smaller contracts, Net 30 to 45 for enterprise. A DSO of 30 to 45 days here isn't a red flag, it's the terms working as designed.
Per ClearReceivables 2026 Industry Benchmarks and Credit Research Foundation data, SaaS and subscription businesses average 37 days DSO, with a normal range of 28 to 48 days. Compare that to a broad cross-industry median in the mid-to-upper 50s, and SaaS looks like one of the faster-collecting sectors around, which tracks given how much of the category runs on cards.
Annual prepayment is the single strongest lever available for pulling DSO down. Companies that negotiate customers into paying upfront for the year, rather than billing monthly or quarterly, cut DSO by 40 to 60%. That's not a rounding error, that's a structural shift in the cash cycle.
There's also a quieter risk hiding inside the DSO number for subscription businesses: churn. Failed renewals and declined cards don't look like slow-paying customers in the traditional sense, they look like a customer who just stopped paying. A DSO uptick clustered around renewal dates deserves its own line of investigation, separate from the aggregate metric, because it's often an early churn signal wearing a collections costume.
And if a company runs a mix of annual prepaid, quarterly, and monthly billing customers through the same AR balance, the blended DSO will hide more than it reveals. A collections problem in the monthly-invoiced segment gets diluted by all the near-instant card payments sitting next to it in the same pool. Segment by billing type first. Calculate DSO within each segment. Only then does the number mean anything.
Two calculation methods and when each one is the right tool
The standard formula, ending AR divided by period net credit sales, times days, is fast and requires almost no extra data. For a company with revenue spread evenly across the month, it works fine. Most ERP systems default to it for exactly that reason.
The assumption baked into it is that revenue is distributed evenly across the period. That's a fair assumption for a manufacturer shipping the same volume of widgets every week. It's a bad assumption for a SaaS company that closes half its deals in the last five days of the quarter. When that happens, Q1's AR balance is loaded with receivables from late-Q4 signings, and the simple formula reads that as if the whole quarter's sales generated it evenly. DSO looks inflated for reasons that have nothing to do with collections performance.
The countback method (sometimes called the exhaustion method) fixes this by tracing actual cash flow logic instead of averaging it away. Walk backward from the AR balance, month by month. Subtract each month's sales from what's outstanding. Full months where AR still exceeds that month's sales count their days in full. The final partial month gets a fractional day count: remaining AR divided by that month's sales, times the days in the month.
This isn't a theoretical fix. The countback method, which originated in Nestlé's Malaysian market, was evaluated and selected for a global rollout specifically because it handles the sales fluctuations that the simple method flattens out. If a global consumer goods company needed a method that could survive uneven sales patterns across dozens of markets, that's a reasonable signal for any deal-weighted SaaS business to take seriously.
The practical move: keep the simple method for day-to-day tracking since it's fast and most systems already calculate it. Run countback quarterly as a sanity check. If the two numbers diverge sharply, that's the tell that a single large late-quarter receivable is skewing the standard calculation.
Best Possible DSO: separating structural collection time from operational failure
DSO on its own answers "how long does cash take to collect." It doesn't answer whether that time is expected or a symptom of something broken. Best Possible DSO fills that gap.
BPDSO takes only current, not-yet-overdue receivables, divides by total credit sales, and multiplies by days. It answers a specific question: what would DSO look like if every single invoice paid exactly on its due date, no exceptions, no stragglers? The gap between actual DSO and BPDSO is where the operational problems live: slow payers, missed follow-up calls, disputed invoices sitting unresolved, gaps in the dunning cadence.
A worked example from Cleavr puts numbers to a BPDSO of 35 days against an actual DSO of 52 days, leaving a 17-day gap. For a company doing €10 million in annual revenue, that 17 days translates to roughly €465,000 in cash sitting somewhere it shouldn't be.
The split does real diagnostic work once you start tracking it over time. If BPDSO itself is climbing, that's a terms problem, payment windows are getting longer, probably from a negotiation or a policy shift. If ADD is climbing while BPDSO stays flat, that's a process problem, follow-up cadence slipping, disputes piling up, or a customer portal creating friction. And if both numbers sit flat but DSO overall runs high, that's not a failure at all, it's just a business with long payment terms by design.
For AR teams trying to get budget for better tooling or headcount, this split is the argument, in dollar terms, for why collections operations deserve investment.
The cash flow cost of DSO drift during fast growth
DSO moves roughly in lockstep with revenue. Double revenue while holding DSO constant, and AR doubles right along with it. That's expected. What's dangerous is when DSO creeps upward during the same growth stretch, because then AR grows faster than revenue, and cash gets tied up faster than the business is generating it.
Run the numbers on a hypothetical SaaS company at $5 million ARR with 45-day DSO: roughly $620,000 is in AR at any given moment. Cut DSO to 30 days, and about $210,000 of that frees up immediately, with zero change to pricing or revenue. That's cash that was always there, just parked in the wrong place.
A JPMorgan working capital study found that SaaS companies cutting DSO by 7 days freed cash equal to roughly 2% of annual revenue. For a $50 million ARR company, that's $1 million in additional cash flow, generated by nothing more than tightening the collections process.
One useful diagnostic here is the DSO Efficiency Ratio: actual DSO divided by stated payment terms. A ratio between 1.0 and 1.15 means collections are running close to terms, which is healthy. Ratios from 1.15 to 1.30 are generally acceptable, still within normal friction. Above 1.50, though, it's a compounding problem, and it gets worse every billing cycle it goes unaddressed, because the gap between what's owed and what's collected keeps stretching.
Adjustments that reduce the AR balance without representing actual cash collected are a quieter distortion worth watching, since they can make DSO appear healthier than collections performance actually warrants.
How AR is resourced determines cash flow directly: a properly staffed AR function, in-house or outsourced, typically runs 5 to 10 days lower DSO than a comparable company running collections as an afterthought. At growth scale, that spread is real money, and it's worth putting a dollar figure on it for the CFO rather than treating it as a soft operational nicety.
Why professional services needs a different primary metric alongside DSO
DSO has a blind spot in professional services that doesn't exist the same way in product businesses: it only starts counting once the invoice goes out. Everything that happens before that, the work getting done, sitting unbilled while someone in finance gets around to generating the invoice, is invisible to DSO entirely. That's where services firms bleed cash quietly, and DSO alone will never show it.
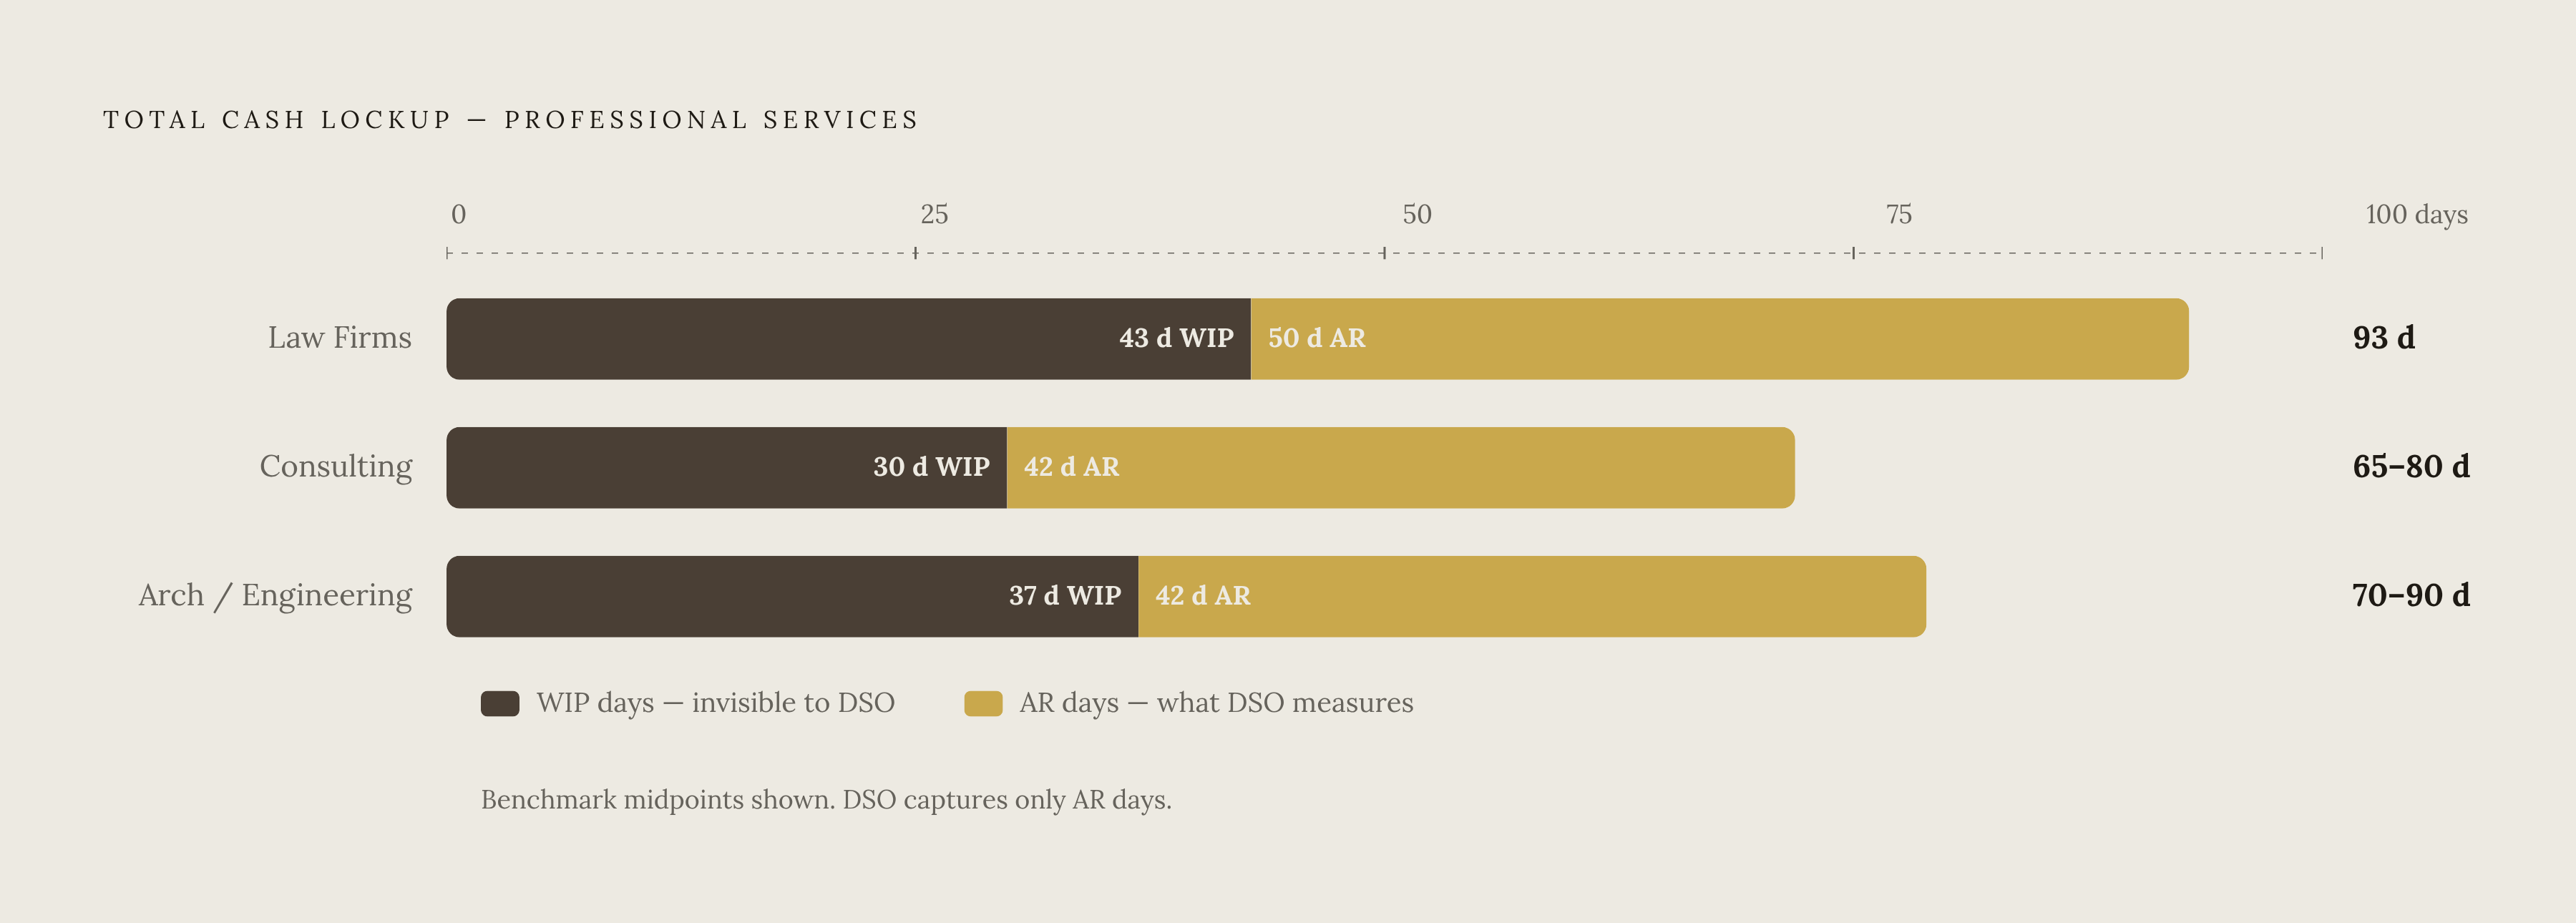
The fuller picture is total lockup: WIP days (time from work completed to invoice sent) plus AR days (invoice sent to cash collected). DSO only measures the second half of that equation.
The benchmarks, per nstarfinance.com, show how much this varies by firm type. Law firms run a median total lockup around 93 days, roughly 43 days of WIP plus 50 days of AR. Consulting firms run tighter, 65 to 80 days total, split between 25 to 35 days WIP and 40 to 45 days AR. Architecture and engineering firms run a similar range, 70 to 90 days total, with 30 to 45 WIP days and 40 to 45 AR days.
Alongside DSO here, track the time work sits before it gets invoiced, a metric sometimes called Days Unbilled Outstanding. Minimizing that lag is the goal; the shorter the better. Anything meaningfully longer than that isn't a collections issue at all, it's a billing process issue, and no amount of chasing customers for payment fixes a problem that starts before the invoice even exists.
There's also a denominator question specific to services: if the goal is measuring collections effectiveness, unbilled revenue shouldn't be part of the DSO calculation at all. You can't collect on work that hasn't been invoiced yet, so folding it into the denominator just distorts the number. Track unbilled time separately instead.
Milestone billing adds another wrinkle. On projects spanning months with payments tied to milestone completion, AR doesn't even appear until someone verifies the milestone was hit. Firms that tighten the gap between milestone completion and invoice generation cut their WIP days directly, without renegotiating a single payment term or touching the customer relationship at all.
Professional services DSO, per Credit Pulse benchmarks, averages 43 days, with a range of 30 to 58 days. Firms running above 55 typically aren't dealing with worse customers, they're dealing with a follow-up process that stopped happening consistently after the invoice went out. That's a process fix, not a customer-quality problem.
Choosing the right inputs for your billing model: a decision framework
Before touching the DSO formula at all, identify the billing structure actually in play, because that determines which version of the calculation even applies.
Running automated card billing exclusively? DSO will read near zero by construction, so the more useful signal to monitor is failed renewals and card declines, not DSO itself. Running manual enterprise invoicing on contracts with no return, refund, or cancellation clause? Use billings as the denominator. If that clause exists in the contract, switch to GAAP recognized revenue instead. And if the customer base is a mix of prepaid annual, quarterly invoiced, and monthly invoiced accounts, segment before calculating anything. A single blended number across all three will mislead more than it informs.
Next, match the calculation method to the revenue pattern. Even, predictable monthly revenue calls for the simple method, no need to overbuild here. Seasonal or deal-weighted revenue, the kind common in enterprise SaaS with quarter-end closing surges, calls for a quarterly countback run to check that the simple method isn't getting skewed by a concentration of late-period deals.
From there, layer in BPDSO and ADD to separate structural collection time (the terms customers were given) from operational drag (the follow-up that didn't happen). That gap, expressed in dollars, is the clearest case for investing further in AR operations.
Services firms need one more layer: track DUO alongside DSO, because total lockup, not DSO in isolation, reflects the real cash cycle. Optimizing DSO while ignoring high WIP days is solving the wrong half of the problem.
None of this replaces the unglamorous work of actually chasing money. Supplier portals like Coupa or Ariba, missing tax forms, communication gaps between AP and AR departments, these are the operational blockers that inflate ADD and WIP days no matter how precisely DSO gets calculated. A cleaner formula reveals where the delay lives. It doesn't make the delay disappear. That still takes working through each blocked invoice, one at a time.
For context on where a given number should land: SaaS and subscription businesses average 37 days DSO with a 28 to 48 day range (Credit Pulse / Hackett Group / Credit Research Foundation), with anything above 55 days signaling a process issue rather than a customer issue. Professional services average 43 days, ranging 30 to 58. Broader SaaS industry estimates put the range at 30 to 50 days. Across all industries combined, the median is 56 days, with a global average near 59. Those numbers are a starting point for judging a given DSO, not a verdict on their own, since the right benchmark always depends on the billing model that sets it.