Weekly AR Dashboard Design for Controllers and CFOs
CFOs and controllers need separate AR views to act on cash flow faster.

DSO climbed 9.5% in 2026. Around 60% of US CFOs now call AR tooling a top priority. Those two facts alone should kill any argument that a monthly aging report still cuts it, and any finance leader watching customers pay slower already knows it in their gut.
Start with the customer side. About 67% of finance leaders say customers are paying slower than they were six months ago, and 48% have shifted to more conservative cash management because of it. Meanwhile, 73% of organizations still run AR by hand, burning 12 to 15 hours a week on data wrangling a dashboard should handle in seconds. That's close to two full workdays spent moving numbers around instead of acting on them.
Half of North American CFOs name digital finance transformation their top priority for 2026. Deloitte's CFO Signals survey found half of North American CFOs name digital finance transformation their top priority for 2026. What's missing is the design work: deciding what a weekly AR dashboard should show, in what order, to whom, and why weekly beats every other cadence. Daily works for liquidity questions, monthly for variance analysis, quarterly for the board. Weekly sits at the exact point where an AR problem either gets caught early or quietly turns into a bad quarter. Building the weekly view wrong means the hours clawed back from manual reporting go toward staring at charts instead of deciding anything.
Why one AR dashboard fails everyone
Controllers and CFOs read completely different chapters when they look at AR numbers, and most dashboards fail because they pretend otherwise.
A controller lives inside the closing process. Their questions are granular: which entries are still pending, which reconciliations haven't cleared, which invoice is stuck because someone fat-fingered a PO number. A CFO reads from numbers that are already closed, and needs one question answered fast: on track or not. Same underlying data, opposite presentation needs. Splitting the difference leaves the dashboard answering nobody's question well, the way a menu trying to serve breakfast, lunch, and dinner at once turns out technically edible and satisfying to no one in particular.
Company size decides how sharp that fork needs to be. In a three-person shop, one dashboard can genuinely serve everyone, because there's nobody left to specialize. Past a certain size, roles split, and the dashboards need to split with them: AR clerks need transaction-level tactical views, AR managers need aggregated performance views, CFOs need a strategic summary sitting next to a dozen other numbers they track that week. The bigger the org chart, the more dashboards it needs, not fewer. Trying to collapse them back into one is usually the first mistake a team makes.
That split points to three distinct builds. A cash flow-focused dashboard, built for the CFO, runs a rolling 90-day forecast, expected versus actual, payment risk scores, and a promise-to-pay tracker, the view for someone planning payroll and vendor payments three months out. A collections performance dashboard, built for the controller or AR manager, tracks collector metrics like resolutions per day and average resolution time, a dispute aging bar chart, and a top-overdue list, the place where a manager spots a collector falling behind and steps in with coaching instead of a lecture. An executive summary dashboard, CFO and board-ready, shows five key numbers meant for a thirty-second scan, not a deep read.
Pick which of these three modes the dashboard actually serves before touching a single metric. Organizations with the bandwidth should build all three as a layered view, so each role opens the tool and lands on its own default screen automatically.
The metrics that belong on a weekly AR dashboard and the ones that don't
Ten to fifteen core metrics is the range to aim for. Tracking fifty leaves everyone staring at a wall of numbers, unable to tell which one actually matters this week. The discipline here comes down to nerve: leave most of them off.
A few metrics belong on every version of the dashboard, controller and CFO alike.
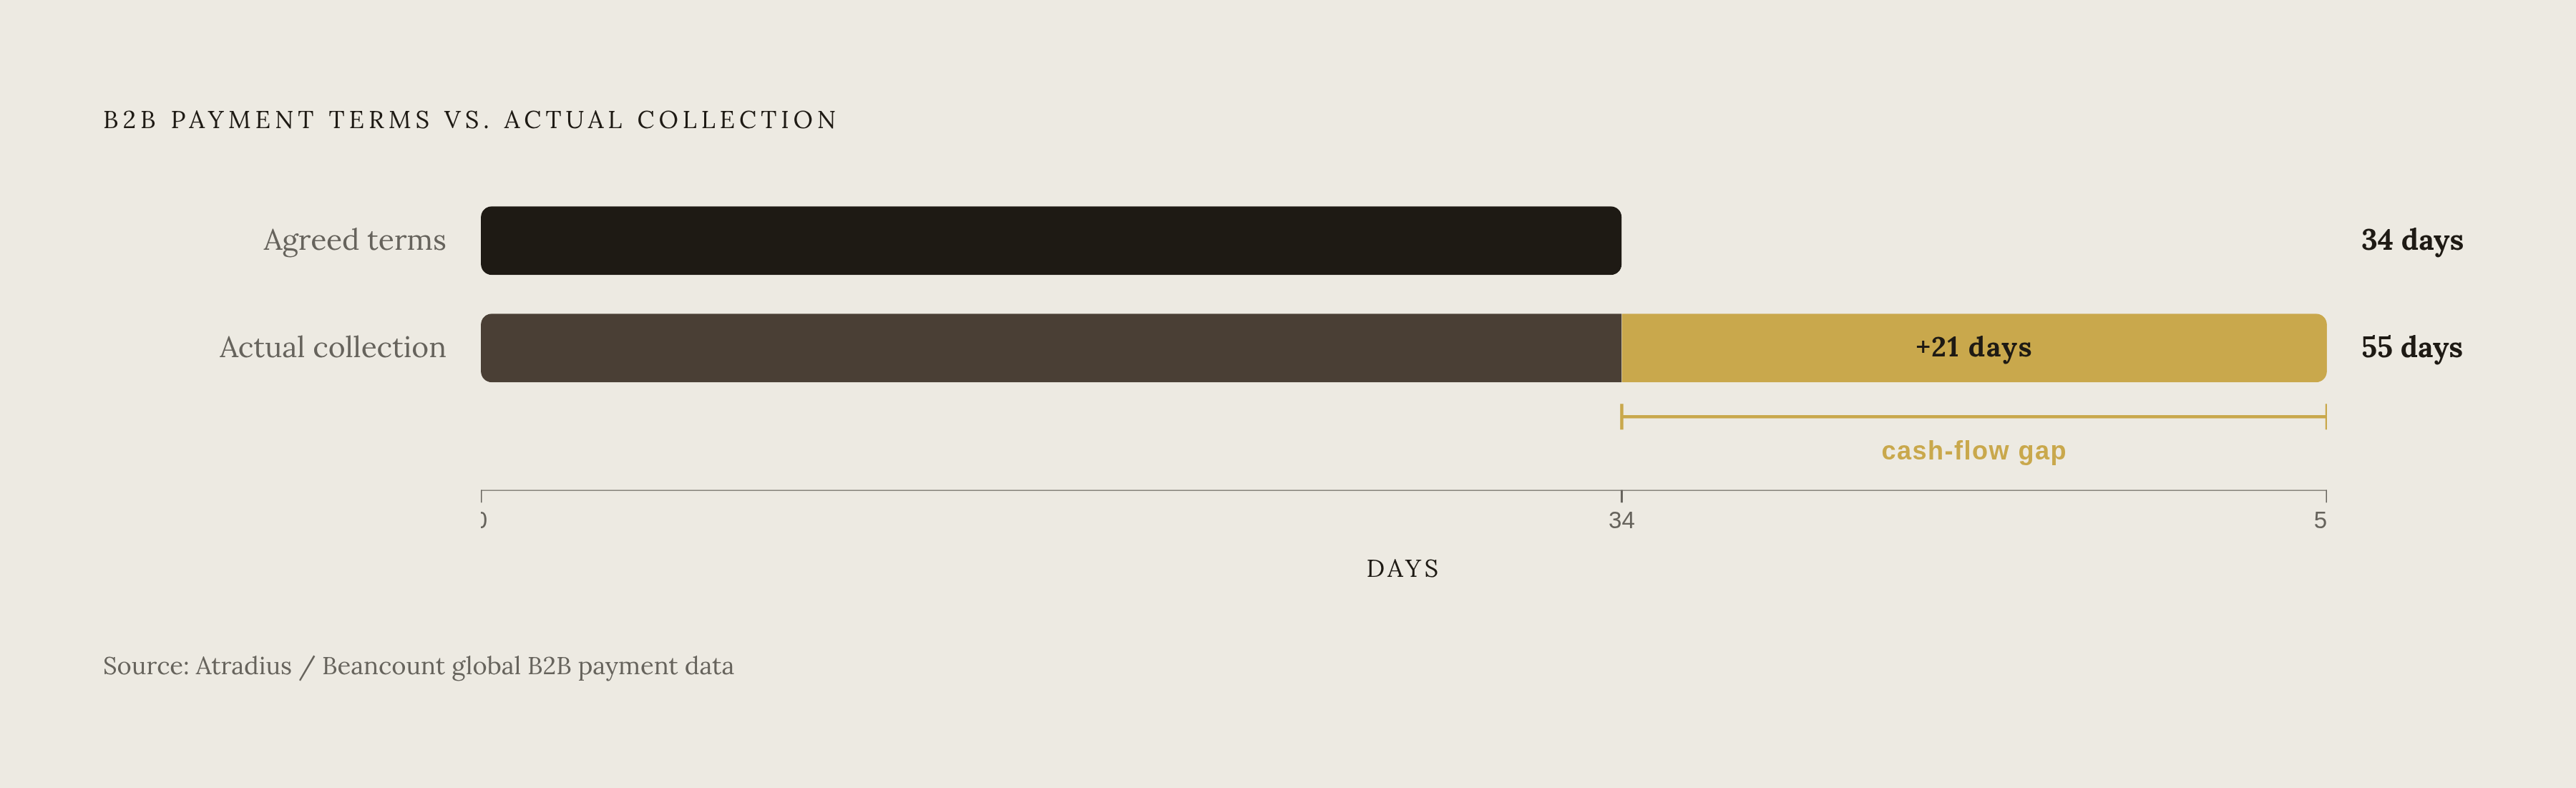
Days Sales Outstanding (DSO) measures how long it takes to turn an invoice into cash. Healthy usually means under 45 days, though that shifts by industry. Atradius data cited by Beancount shows global B2B payment terms averaging around 34 days, while real-world collection averages land closer to 55. That 21-day gap between agreed terms and actual collection is where a company's cash quietly disappears.
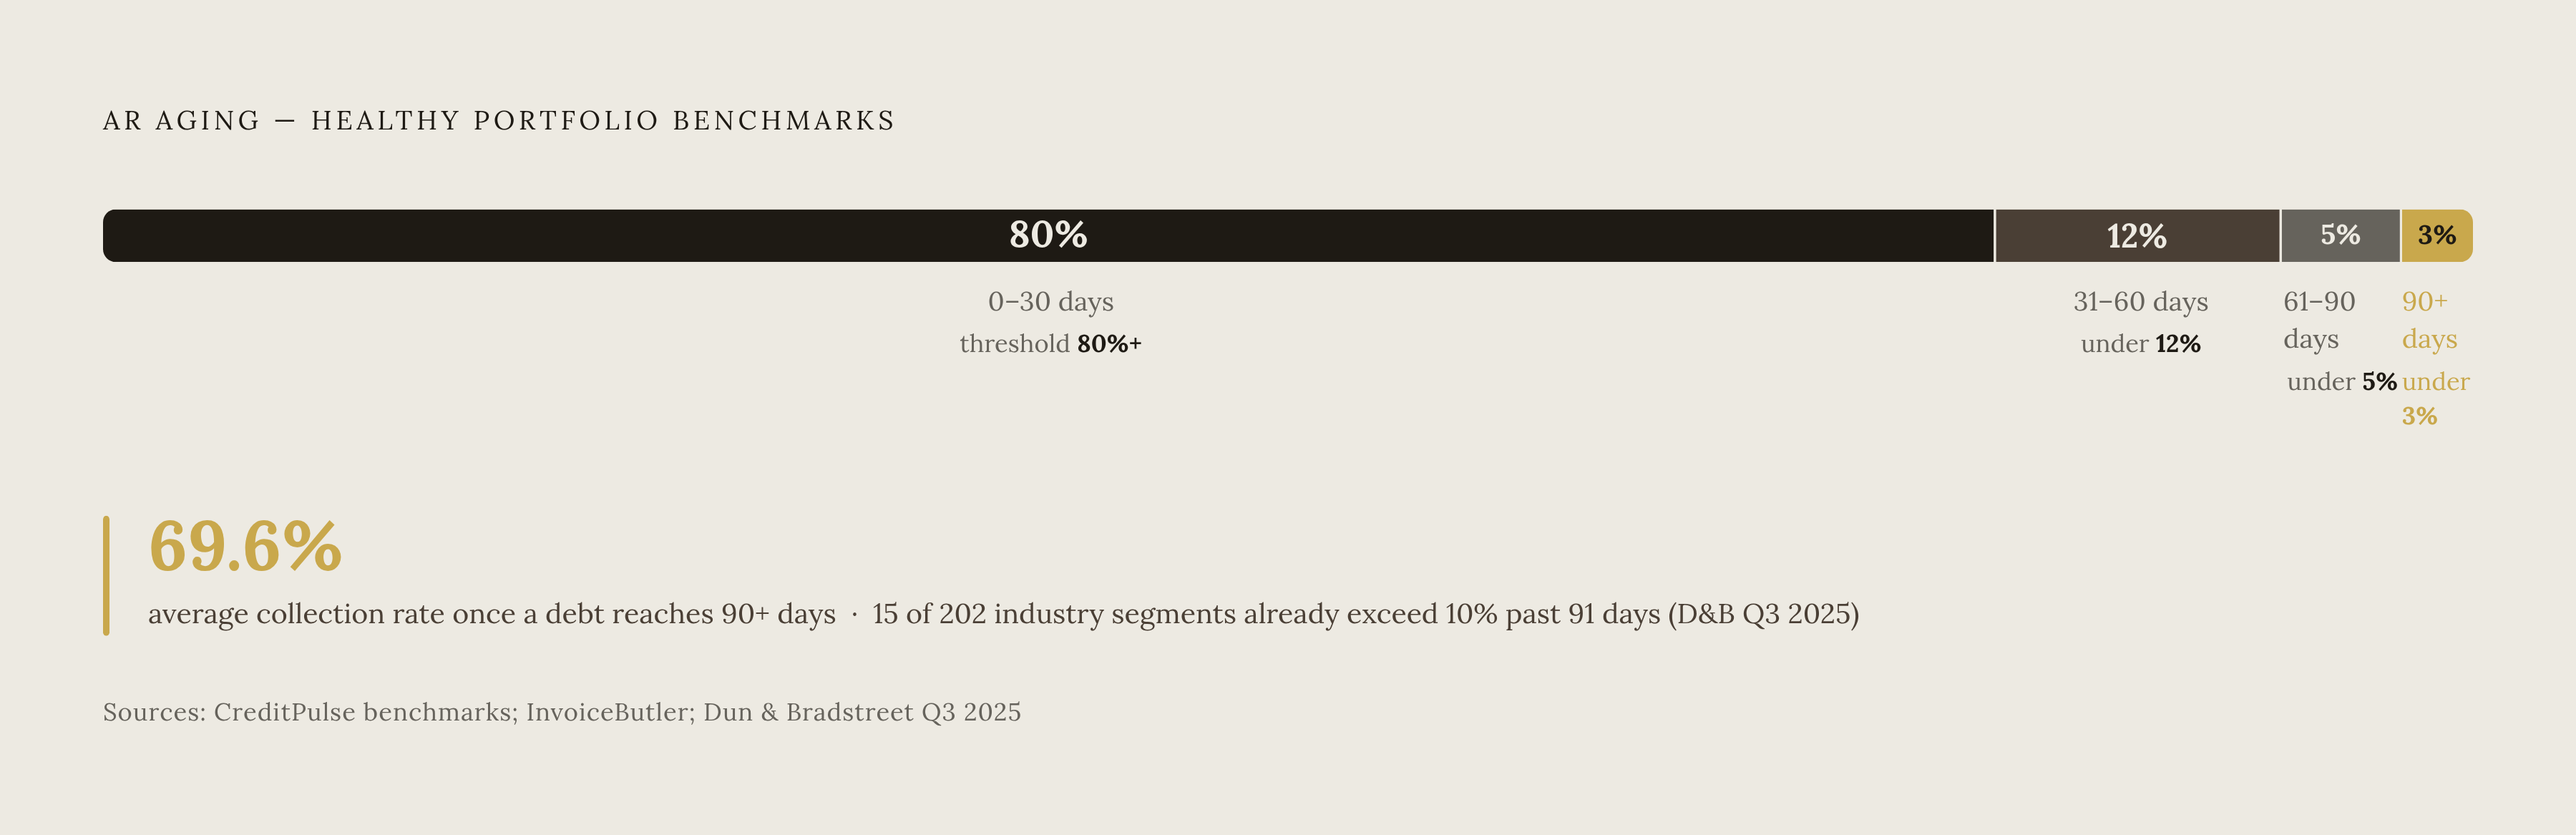
AR Aging Buckets (0-30, 31-60, 61-90, 90+ days past due) show who owes what and for how long. CreditPulse's benchmarks put 80%+ of receivables current, under 12% in the 31-60 bucket, under 5% in 61-90, and under 3% in 90+. Anything drifting into that 90+ bucket needs eyes on it immediately, since one estimate puts the average collection rate on debts that old at just 69.6%. Dun & Bradstreet's Q3 2025 AR Industry Report found 15 of 202 tracked industry segments already carrying more than 10% of receivables past 91 days, a warning light rather than a rounding error.
Collection Effectiveness Index (CEI) strips out DSO's blind spots and measures collections performance on its own terms. ARDEM reports that high-performing organizations keep CEI above 90%, and a slipping CEI is often the earliest sign collections discipline is eroding, even while DSO still looks fine.
AR Turnover Ratio rounds out the universal tier: a high ratio means prompt collection, a low one means collection is lagging.
For the CFO's weekly cut specifically, a second tier earns its spot. Average Days Delinquent (ADD) measures lateness against agreed terms rather than total days outstanding, which matters because a company running 60-day terms might show a high DSO but a low ADD, meaning customers are paying exactly on time, just on generous terms. ADD is the metric that separates a pricing problem from a collections problem. A Bad Debt Ratio trend line catches deteriorating customer credit before it becomes a write-off. Invoice dispute percentage and credit onboarding timeline round out the tier: Both sit just outside the traditional metrics but still choke cash flow when ignored.
Leave off anything that needs a drill-down just to be understood on its own, and anything duplicating a metric already doing that job better. On cadence, Monthly aging review is too slow for how fast these numbers move now.
The DSO-aging trap that makes dashboards misleading without both metrics together
A dashboard can look perfectly healthy and still be lying. That trap catches finance teams who should know better.
A company collecting 80% of its AR cleanly within 30 days, while quietly ignoring its 90+ bucket, shows a fine DSO right up until those delinquent accounts convert into write-offs. A DSO that reads as solid on paper can still mask a portfolio where a meaningful share of accounts sit past 90 days, propped up by a handful of large customers paying on time and dragging the average down with them.
DSO and aging answer two different questions, and treating them as interchangeable is the mistake most dashboards make. DSO gives a single, portfolio-level read on collection health, the number a CFO checks against the cash flow forecast. Aging gives account-level specificity: who owes what, and who needs a phone call today. Neither substitutes for the other, and any dashboard that shows only one is showing half the picture.
Datarails identifies a rising DSO as usually the earliest signal of a coming cash crunch, but only when read next to the aging buckets. Read alone, DSO can't tell a broad slowdown across the customer base from a concentrated problem sitting in two or three large accounts. Dropping one metric in favor of the other leaves the dashboard with a blind spot that becomes visible only when it appears as a bad debt entry on the income statement.
That's a layout problem at its core, and layout is fixable.
Layout hierarchy that turns the dashboard into a decision sequence, not a chart collection
DSO and aging go first, side by side, for the cash flow view. Then CEI and the promise-to-pay tracker, for the collections team. That sequencing isn't arbitrary: it mirrors how a CFO's brain actually processes "are we fine or not," moving from the big number down to account-level detail only when something looks off.
The CFO dashboard functions as a control panel. Mandrill's framing describes a well-built one as surfacing margin erosion, cost overruns, and cash flow risk before they turn into a crisis, the same way a car's dashboard flags an overheating engine before it seizes on the highway.
The Executive Summary structure is a good model: a top band of five numbers, each with a trend arrow, covering DSO, aging percentage, CEI, top-ten overdue by dollar, and bad debt forecast. Built to be read in thirty seconds. If it takes longer, there are too many elements on it, full stop.
Trend beats snapshot, every time. A raw number says where things stand today. A trend line says where things are headed, and that's the version that actually catches problems before they hit cash flow or blow up a close cycle. A declining CEI might reflect an operational issue rather than a collections failure. A rising bad debt ratio usually signals credit deterioration on the customer side. Slower dispute resolution points to a bottleneck in the dispute workflow itself. Each of those reads completely differently as a trend than as a frozen number.
Datarails notes that for the cash flow view, a waterfall-style chart showing the bridge from opening cash to closing cash does more work than a table of figures ever will. It shows the shape of the movement. Variance metrics, paired with real-time alerts and drill-down capability, catch problems as they happen instead of surfacing them for the first time at month-end close.
Putting account-level detail, transaction tables, and the collector's queue on the same screen as the CFO's scorecard is a layout mistake dressed up as thoroughness. Fix it with role-based default views instead.
Role-based and context-aware design: how the same data serves the controller and the CFO without two separate builds
FuseLab's research describes context-aware design as changing what the dashboard shows based on who's logged in, what time it is, and what's on that person's calendar next, all without anyone touching a settings menu. That's a step past a saved preference. The system watches behavior over time and rearranges the information hierarchy on its own.
A controller logging in on close day sees pending reconciliations and aging detail the moment the screen loads. A CFO logging in Monday morning sees the DSO trend, the aging percentage, and the cash position, front and center. The same database drives both screens, producing completely different front doors.
FuseLab points to the Fiserv Small Business Index as a working example: every regional stakeholder wanted their own numbers first, without clicking through a national overview to get there. The lesson carries straight over to AR. Whatever question the user is about to ask, the dashboard should already have the answer loaded before they type it.
For teams not running fully context-aware software yet, role-based templates solve most of the same problem at a fraction of the complexity. Set the default view per role once, at setup, rather than expecting every controller and CFO to build their own configuration from scratch. The controller's default is the Collections Performance Dashboard: collector metrics, dispute aging, top overdue accounts, built so a manager can spot a training gap and escalate a stuck account without clicking away. The CFO's default is the Executive Summary or Cash Flow-Focused view: strategic numbers, trend arrows, forecast against actual, with transaction detail available only on request.
One more piece drives all of this. Datarails notes that a live-connected dashboard updates the moment new actuals land, no rebuild, no manual refresh, while a spreadsheet sits static until someone remembers to touch it. For a weekly cadence, that gap means figures reviewed on Monday can already be five days stale by the time anyone acts on them. Stale data on a weekly review defeats the entire point of reviewing weekly.
The AI layer that is already changing what a weekly AR dashboard can do
FuseLab cites a Gartner forecast projecting 40% of enterprise applications will carry task-specific AI agents by the end of 2026, up from under 5% in 2025. Dashboards are among the first tools absorbing that shift, and AR dashboards fit naturally, given how much of the job comes down to pattern-spotting across large sets of invoices.
FuseLab's analysis describes the structural change as moving dashboards from manual chart configuration toward AI-generated insight, and from menu-driven clicking toward conversational interaction. That structural change appears in a few concrete ways. Datarails notes that a narrative layer updates alongside the numbers, explaining what changed and why, instead of leaving that explanation as a separate task for an analyst. Anomaly detection flags a spike in the 61-90 day bucket before Monday's review starts, not during it. And on the more ambitious end, agentic AR systems don't just flag problems, they act on them: following up with customers directly, navigating a supplier portal, escalating an account once a threshold is crossed. That turns the dashboard from a read-only report into something closer to a command center.
One caveat matters here, straight from FuseLab's own 2026 assessment: AI personalization and conversational interfaces are shipping in real products today, but context-aware design is still mostly experimental. Treating an experimental feature as production-ready is how a finance team ends up rebuilding the same tool twice. Sequence it in order: foundational metrics and layout first, AI layered on once that's proven out.
FineReport/Fanruan reports that one technology company brought DSO down from 65 to 42 days and tightened cash flow forecast accuracy from plus-or-minus 20% to plus-or-minus 5%. That's an illustration of what the right setup makes possible, and results like it depend on every rollout getting the sequencing right. Get the metrics and layout right first, then let AI sit on top of a foundation that already works; that sequencing is what actually matters.
Building the weekly review cadence that makes the dashboard a habit, not a chore
Daily fits liquidity questions, weekly fits cash flow and AR review, monthly fits variance analysis, quarterly fits the board. Weekly belongs to AR because that's the rhythm at which aging shifts, disputes surface, and promises to pay either hold or break.
A dashboard only earns its keep if someone actually opens it on schedule. The Monday morning view has to answer "are we on track" inside thirty seconds, the same discipline built into the Executive Summary layout above. The controller's mid-week check has to be fast enough to fit between closing tasks. Build the cadence around the finance calendar's actual rhythm, not around whatever default schedule an off-the-shelf tool assumes for everyone.
The habit forms the moment the dashboard answers the question faster than digging through a spreadsheet would. Once it does that reliably, nobody needs reminding to check it. They just do, the same way anyone glances at a weather app before grabbing a jacket.