Cash Flow Forecasting From AR for a Controller Without a Treasury Team
Use your AR data to forecast cash flow week by week without a treasury team.

A controller without a treasury team still has to answer the same question every Friday afternoon: will there be enough cash in the account to make payroll in three weeks? Accounts receivable data is the answer key, and this piece walks through how to actually build a forecast from it, week by week, without a treasury department to lean on.
What the late-payment environment looks like in 2025-2026, and why it makes forecasting harder
Global working capital climbed to 78 days in early 2025, its highest level since 2008. That's the pool every controller is wading through right now, and it's rising, not falling.
Zooming into the invoice level makes the picture messier. A PYMNTS survey found that around 57% of invoices are paid late, and 33% take more than 90 days to settle. Additional research adds more texture: 47% of US small businesses say at least some invoices are more than 30 days overdue, and 56% report being owed money on unpaid invoices, with an average of roughly $17,500 outstanding per business. In the first quarter of 2025, 17 out of 209 US industry segments had at least 10% of their receivables 91 or more days past due.
Then there's write-offs. Roughly 5% of long-overdue invoices get written off entirely, and bad debt eats up about 6% of credit sales across North America. None of this is a rounding error. It's the gap between what your payment terms say and what customers actually do, and that gap is exactly where forecasts fall apart.
If a company's Days Sales Outstanding is running at 51 days on net-30 terms, and the forecast still assumes 30-day collection, every invoice overstates the cash position by three full weeks. Multiplying that across a full AR ledger means the forecast isn't a little off, it's fictional. Pulling raw AR numbers and plugging them into a spreadsheet without a structured method produces a forecast that looks tidy and tells you nothing true.
AR as the right starting point for a short-term forecast, versus P&L
The P&L records revenue the moment it's earned, not the moment cash actually lands in the bank. It also carries non-cash line items like depreciation, so a sale can make the P&L look great in a month when the invoice hasn't been touched. A cash flow forecast has to track something else entirely: real money moving in and out, because that's the only thing that tells you whether payroll clears, vendors get paid, and debt covenants stay intact.
There are two ways to build that forecast. The direct method tracks actual cash transactions, customer payments, supplier payments, payroll, taxes, basically watching the bank account line by line. It's the more accurate choice for anything short-term. The indirect method starts from projected net income and works backward, adjusting for non-cash items and working capital changes. That's better suited for long-range, directional planning tied to the close cycle, not for figuring out if there's enough cash on hand next Tuesday.
For a controller running solo, the operational benchmark is a rolling 13-week direct-method forecast, built on scheduled transactions rather than projected income. Thirteen weeks in weekly buckets is the standard unit for short-term liquidity work, refreshed weekly as new payment and sales data comes in. For the annual view, monthly buckets make more sense and line up naturally with the close cycle and working capital review.
Rolling beats static, full stop. A static forecast is a photograph, accurate the day it's taken and increasingly wrong every day after. A rolling forecast moves with the business as new data lands, which is the entire point of doing this weekly instead of quarterly.
The three methods for forecasting cash inflows from AR, what each one does, and where each one breaks
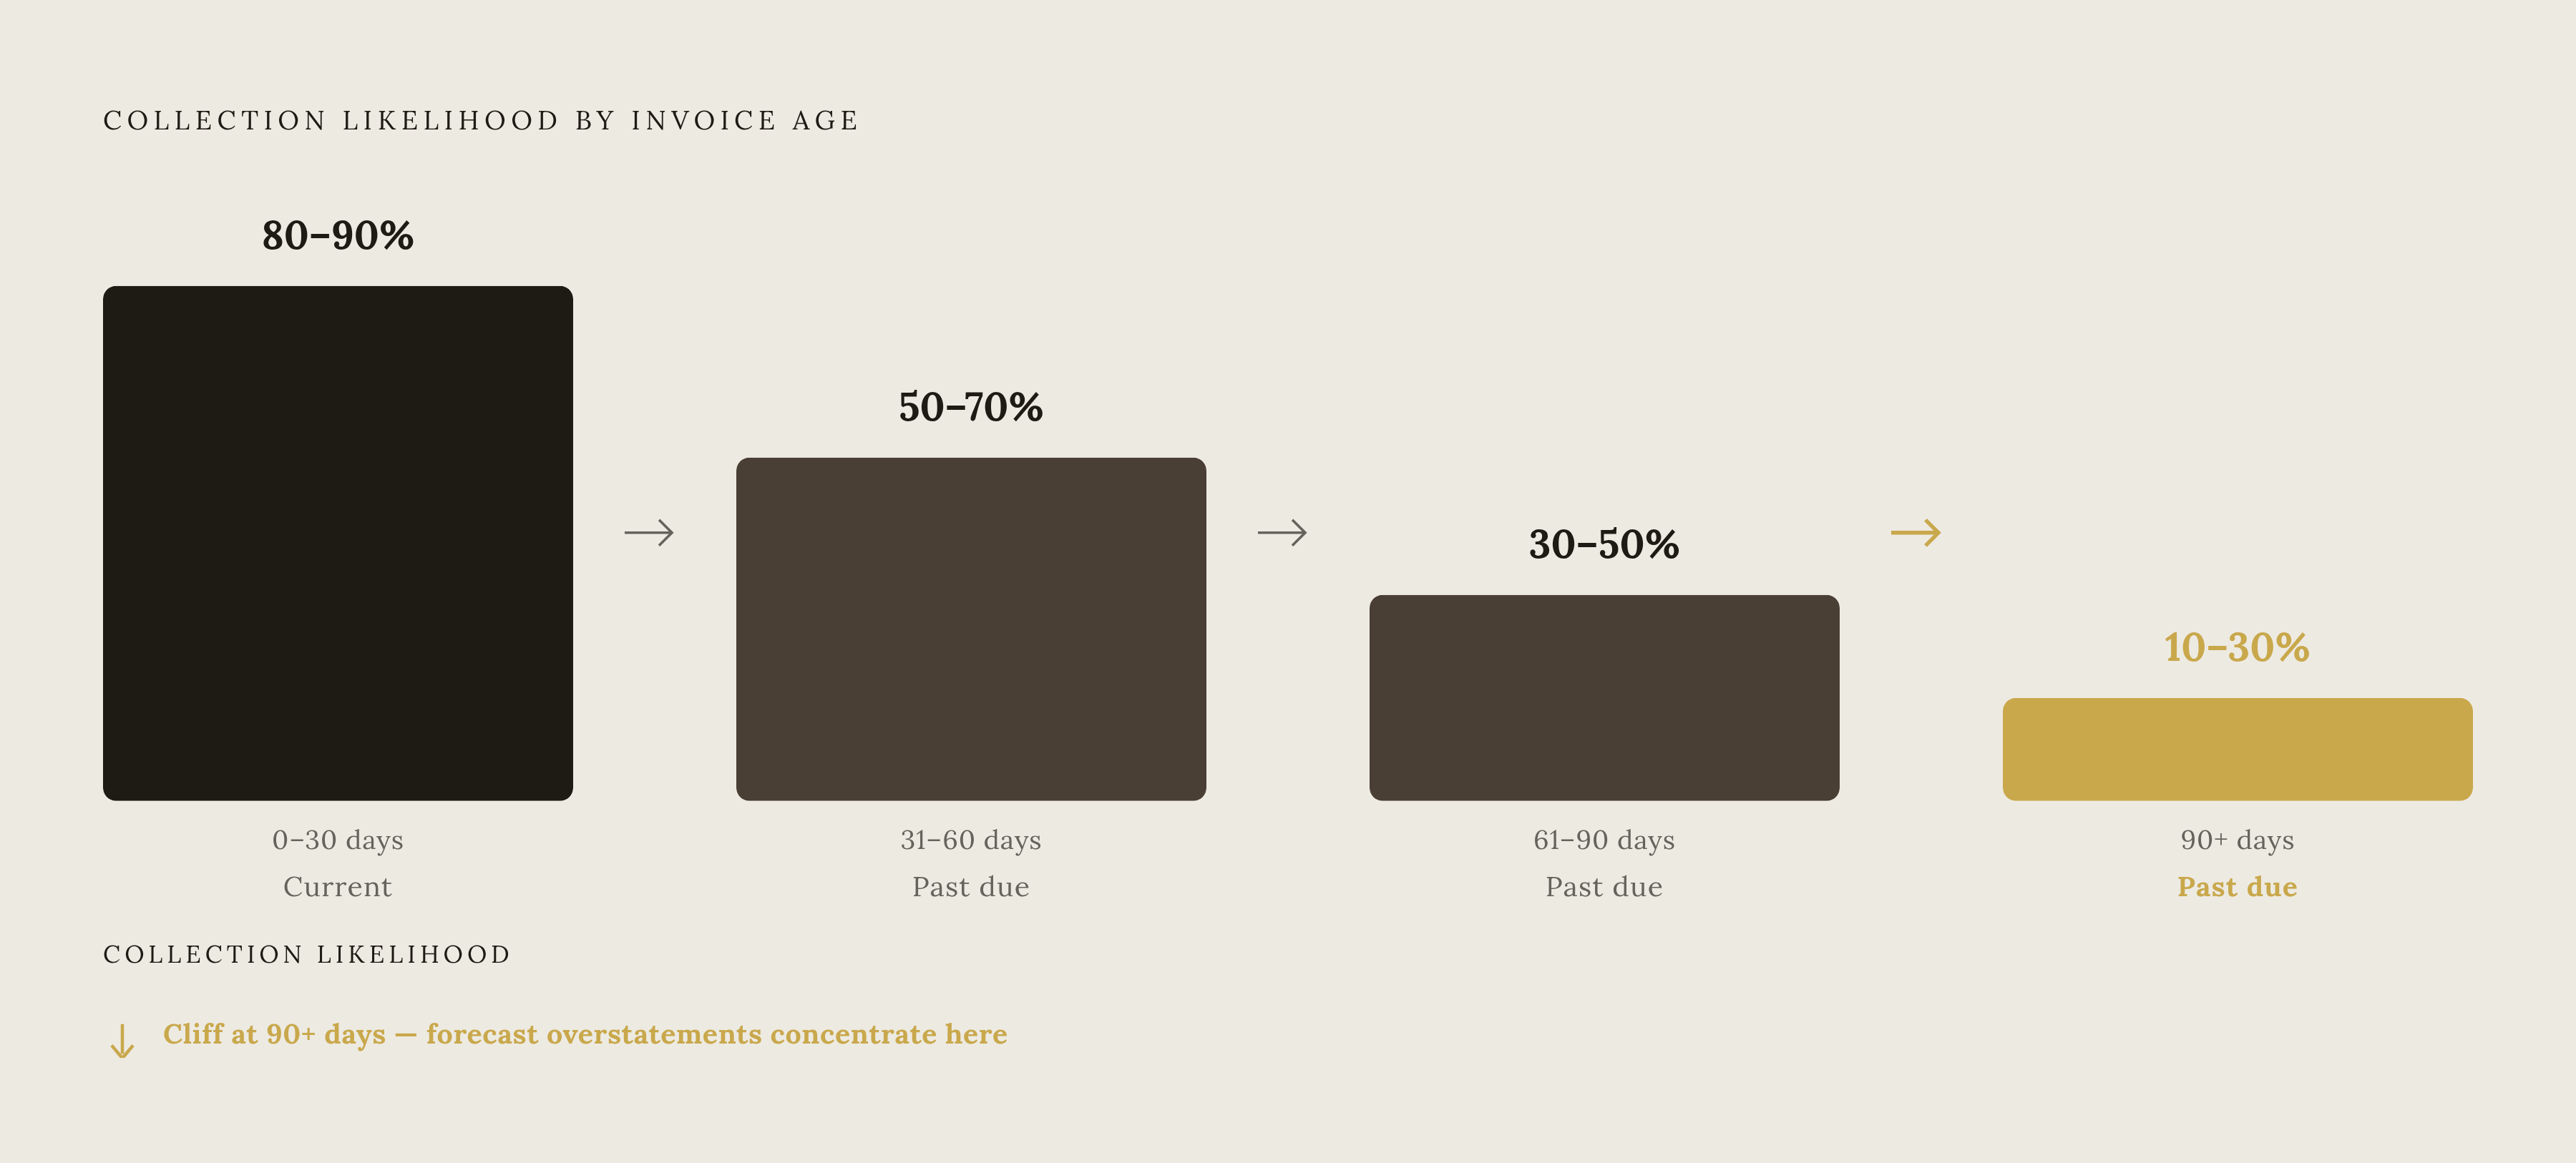
Method 1: AR aging bucket model is the manual default, and it's still how most people do it. PYMNTS research cited by Transformance found about 72% of finance leaders forecast cash flow manually, usually by exporting an aging report and applying a collection probability to each bucket: Current (0-30 days), 31-60, 61-90, and 90-plus days past due.
Numeric's cash flow forecasting guide suggests reasonable starting probabilities: 80-90% collection likelihood for current AR, 50-70% for 31-60 days, 30-50% for 61-90 days, and 10-30% for anything past 90. Simple, fast, and flawed in a specific way. These are averages, and averages flatten everything. Transformance's research found that a reliable customer with a clean invoice gets bucketed the same as a chronic slow payer sitting on a disputed charge. The individual signal disappears into the group number. Use this method for a quick liquidity check when time is short.
Method 2: DSO-based forecasting. DSO is calculated as average accounts receivable divided by net revenue, multiplied by 365 days. From there, the AR forecast becomes DSO multiplied by sales forecast divided by the time period. Typical DSO is between 30 and 60 days. Anything under 45 is considered efficient. Crossing 60 usually signals collections are slipping.
The problem with a single company-wide DSO number is the same problem as the aging model: it buries customer-level risk. The problem is that slow payers get averaged into the total and vanish from view. The fix is straightforward, if a little more work: segment customers into risk bands and apply a separate DSO assumption to each band, so the forecast reflects how people actually pay rather than a smoothed-over average.
Method 3: DSO countback method. Instead of one point-in-time number, this method looks at collection patterns across multiple historical periods, accounting for swings in sales volume and building a foundation for rolling forecasts. It works best with enough historical data to catch seasonal patterns, with the look-back window sized to match how stable or volatile the customer base is. This method is diagnostic more than predictive. It's good for stress-testing whether the aging-bucket assumptions still match reality, or whether customer behavior has quietly drifted since the model was built.
Why forecast accuracy lives or dies on whether AR converts to cash on schedule
Getting this wrong costs real money. Agicap's survey of US mid-sized companies found unreliable cash flow forecasts cost an average of $465,000 a year, and 43% of US mid-market companies operate on forecasts unreliable enough to trigger unexpected cash deficits over $50,000 roughly every 20 days.
The model is only as good as whether AR actually converts to cash on the timeline it assumes, which is the uncomfortable truth underneath all three forecasting methods. If an invoice is sitting unread in a procurement portal, or blocked because a required tax form never got submitted, or just quietly ignored in someone's inbox, the collection probability assigned to it was never real to begin with.
The friction points are predictable. Invoices get stuck inside procurement portals like Coupa or Ariba that require someone to actively log in and push them along, not just submit and wait. Missing paperwork, like a required tax form, a purchase order number, or remittance details, can freeze payment processing entirely on the customer's side. And communication gaps, where a disputed invoice ages without anyone escalating it, quietly turn a 45-day receivable into a 95-day one.
Manual process makes all of this worse. The AFP's FP&A Benchmarking Survey found that roughly 96% of finance teams still lean on spreadsheets as their primary planning tool, and when the follow-up on late invoices is manual too, it is the first task to get dropped when the team is stretched thin. Gartner's research adds another layer: 18% of accountants make financial errors daily, 33% weekly, and 59% report several errors a month. Forecasts built on manual entry and linked spreadsheets inherit every one of those small mistakes, and they compound.
The fix lives upstream of the forecast itself. Tighten the collections process, and DSO narrows. Narrow DSO, and the forecast's uncertainty window narrows right along with it. That's the actual lever here, not a better spreadsheet formula.
A weekly maintenance routine for the rolling 13-week AR forecast
A rolling forecast that never gets updated is just a static forecast wearing a disguise. It only earns the name "rolling" if someone actually touches it every week, on a set schedule, without fail.
The weekly refresh has a few fixed steps. Pull the AR aging report and compare it to last week's, flagging any invoice that slid from current into the 31-60 bucket or crossed the 60-day mark. Update collection probabilities for any customer whose behavior changed, a late payment last cycle, a new dispute, a payment plan just put in place. Log the prior week's actual cash receipts against what the forecast predicted, then calculate the gap. Then flag invoices at risk of aging further if nobody intervenes, because those are exactly the ones that'll wreck next week's number.
Variance is where the real diagnostic work happens. The AFP's FP&A Benchmarking Survey, cited by Tesorio's research, found that finance leaders still running manual processes commonly report forecast-to-actual variance in the 30 to 40 percent range. When variance runs that high, it usually traces back to one of three things: collection probabilities that no longer match how a customer actually pays, invoices stuck behind operational friction like a portal or a missing document, or a straightforward timing mismatch between when the invoice was issued and when payment actually clears. Track this by customer segment, not just as one blended number, because the aggregate hides exactly the accounts causing the trouble.
Segmentation itself should be a structural part of the model, not an afterthought. Group customers into bands, reliable payers, chronic slow payers, disputed or at-risk accounts, and give each band its own timing assumption. The same principle applies to DSO specifically: apply it at the segment level, never across the whole book as one number.
Finally, build at least two scenarios: a base case, and a downside case where the bottom of each bucket's probability range holds and the slowest payers in every segment set the pace. Stress-testing inflow assumptions this way isn't optional polish, it's a named step in a serious forecasting process, and skipping it is how a controller gets blindsided by a cash crunch that a slightly more paranoid spreadsheet would have caught.
What tools and AR automation can do for a solo controller, and where the gaps still need a human
Most of the industry is still doing this by hand. The AFP's FP&A Benchmarking Survey found that only 23% of finance professionals use AI in forecasting regularly, and 96% still rely on spreadsheets. The AFP's Treasury Benchmarking Survey found that over 60% of treasury professionals name cash forecasting as their single hardest task. So if the process above feels like a lot of manual grinding, that's because it is, for almost everyone.
Automated cash forecasting tools can close some of that gap. Gartner's research found organizations using automated forecasting see up to a 30% improvement in accuracy over spreadsheet-based methods, though that gain only holds if the AR data feeding the tool is clean to begin with. Garbage in, slightly-better-organized garbage out.
What these tools genuinely handle well: real-time visibility into AR aging without a manual export-and-paste routine every Monday morning, collection probability modeling built from actual historical payment behavior per customer instead of a flat bucket assumption, ERP integration that updates the forecast as invoices actually settle rather than waiting for the weekly pull, and scenario modeling (base, upside, downside) without rebuilding three separate spreadsheet tabs by hand.
Quadient's 2026 research on AR trends points to where this is heading: AI for collections outreach and dispute handling, predictive analytics on payment behavior, and real-time reconciliation replacing batch processing, so cash positions get tracked live across systems instead of updated once a week. Research found more than 60% of CFOs planned to boost investment in finance automation in 2025, with AR among the areas drawing that increased attention.
None of it replaces judgment where the actual friction lives, though. A tool can flag that an invoice is stuck in a supplier portal, but it can't log in and push it through, someone still has to do that. It can trigger a reminder about a missing tax form, but it can't chase the response, follow up a second time, or read the tone of a customer who's gone quiet. Automation narrows the busywork. The controller still owns the judgment calls that decide whether the forecast holds up when it matters.