Collection Effectiveness Index vs. DSO for Measuring AR Performance
CEI catches uncollected cash that DSO's speed metric completely misses.

Revenue on paper and cash in the bank are two different things, and the metric a finance team picks to measure AR performance decides which one it actually sees. DSO and CEI are not two ways of saying the same thing about collections. DSO tells you how fast money arrives. CEI tells you how much of it actually arrives. Those are separate questions, and a team that only tracks one can be completely blind to failures happening in the other.
A finance team watching DSO alone can be celebrating a tight collection cycle while a long tail of smaller, older invoices quietly ages past the point of being collectible. The invoice doesn't appear as a crisis in the average; it just sits there, dragging down what actually lands in the bank, invisible to a metric built to measure speed. Plooto's 2026 guide puts a number on this asymmetry: a CEI well below full marks means a meaningful share of every collectible dollar never got collected, a fact DSO has no way of surfacing, and that gap matters because late B2B payments aren't rare. Collecting fast and collecting completely are different achievements, and the distance between them shapes working capital and cash forecasting directly. Most finance teams never choose a metric on purpose. They inherit DSO as the default and stop there. Esker's research found nearly 40% of finance departments don't monitor CEI at all, so they have no way of knowing whether their collections effort is working or just treading water against new invoices coming in the door.
An invoice aging silently past due gets lost inside a speed metric, but it lowers a CEI trend over consecutive months before anyone notices. Tools that track payment commitments and surface aging invoices across channels make that kind of CEI monitoring actionable by keeping older, high-risk balances visible instead of letting them fade into the long tail nobody's watching.
Where the DSO formula breaks down
DSO measures average collection time. The formula is straightforward: take accounts receivable, divide by net credit sales, and multiply by the number of days in the period. What comes out is a single number representing average days to collect, and that single number is also the formula's biggest weakness. Averages flatten the variation among the individual accounts that feed into them. A handful of large customers who pay fast can pull that average down even while a group of chronic slow payers accumulates unnoticed in the background.
DSO also has a revenue-sensitivity problem baked into its structure. A surge in credit sales near the end of a period lowers DSO arithmetically, with or without any actual improvement in collections. A revenue dip does the opposite, making DSO look worse even when the collections team is doing everything right. Plooto's 2026 guide names this directly: "sales fluctuations create an optical illusion." The metric responds as much to billing timing as it does to collection effort, so a swing in DSO can mean the sales team had a good month rather than the collections team had a bad one.
None of that makes DSO a bad metric. It earns its place in specific jobs: comparing performance against industry benchmarks, understanding the cost of carrying outstanding receivables, and tracking performance against standard payment terms. These are the questions DSO was built to answer, and it answers them well. A healthy DSO range in 2026 runs between 30 and 55 days depending on industry. Anyone who leans on DSO daily for those comparisons is using it exactly as intended. The formula's limits appear when someone asks it a question it was never built to answer, like whether the money actually came in.
How CEI Is Calculated
CEI was built to solve the exact problem that trips up DSO. The formula: take beginning AR, add credit sales during the period, subtract ending total AR. Divide that by beginning AR plus credit sales minus ending current AR. Multiply by 100.
Break it into its parts and the logic gets clear fast. The numerator (beginning AR plus credit sales minus ending total AR) represents what was actually collected during the period. The denominator represents what was available to collect, and it excludes invoices that are still within terms and not yet due, which is what makes the formula work.
That exclusion of ending current AR is the real design decision behind CEI. It means a company doesn't get penalized for carrying brand-new invoices that haven't come due yet. CEI only scores performance against what was genuinely collectible in that window, not against every dollar sitting on the books. The Credit Research Foundation developed CEI specifically to give companies with fluctuating sales a more precise read on credit and collections performance, since DSO's revenue sensitivity makes it unreliable in exactly those conditions.
A worked example from Plooto plugs representative figures for beginning AR, credit sales, ending total AR, and ending current AR into that same formula to produce a CEI percentage. The frequency a team runs this at matters too. Monthly CEI works best for operational decisions, like adjusting workflows or escalating specific accounts. A rolling 12-month CEI smooths out seasonal noise and works better for CFO-level benchmarking conversations. Either version depends on clean inputs. CEI requires careful records of beginning AR, credit sales, and the split between current and total ending AR; that kind of data quality is a prerequisite for a usable number.
Getting that distinction right, between invoices still within terms and invoices genuinely past due, requires visibility into invoice status across every channel a customer might use to pay or respond. Automated follow-ups across email, phone, and SMS, paired with the ability to track status and flag commitments, are the kind of capability built into some collections platforms specifically to keep that data hygiene intact.
What a CEI Score Signals About Your AR Function
A single CEI reading tells a finance leader something. The trend over time tells a lot more. Industry benchmarks generally sort scores into bands: a low score signals a large share of collectible cash going uncollected, a middle range signals collections that are working but leaving money on the table, and the upper tier signals a well-managed collections function collecting nearly everything that was due. As a rough marker, a CEI above roughly 80% means an organization is collecting most of what's due within the period. Fall below that line and the process is leaking cash, regardless of how good DSO looks sitting next to it.
The trend carries more diagnostic weight than any single month's number. A CEI sliding downward over consecutive months is an early warning that collections are losing ground, and it appears in that trend before the aging report reflects it. A declining CEI usually points to one of a few specific culprits, credit policy that's gotten too loose, invoicing delays, follow-up that isn't happening consistently, or friction on the customer's end that's slowing payment down, and each of those culprits calls for a different fix, so the diagnostic step matters more than the score itself.
Industry context shifts where the target line sits. Sectors with high rates of late payment, education, construction, and manufacturing among them, carry structurally lower CEI than industries where customers tend to pay on time. What matters is performance relative to the norm in that specific vertical, not performance against some universal number. Read this way, CEI functions as a leading indicator of cash flow risk rather than just a scorecard that reports on the past.
When a CEI trend starts slipping, the underlying cause is often inadequate follow-up, or invoices that are stuck somewhere in a supplier portal collecting dust. Fixing that requires immediate, persistent contact, not another report sitting in an inbox. An approach that combines AI-driven collections outreach with human expert escalation is built to address exactly that kind of operational friction, missing documents, portal delays, unresponsive contacts, the kind of friction CEI can point to but can't resolve by itself.
Where CEI Misleads
CEI earns credibility by being honest about where it runs out of road. It's a summary percentage, and summary percentages are good at compressing a lot of activity into one comparable number while being bad at showing what's hiding inside that number.
Concentration risk is the clearest example. A company can post a solid CEI while one large, badly overdue customer accounts for most of the uncollected balance. CEI aggregates everything into a single figure, so that kind of concentrated exposure disappears into the average the same way slow payers disappear into DSO. Aging reports need to run alongside CEI specifically to catch where overdue balances are concentrated, since CEI only reports how much got collected in total, not where the risk sits.
CEI also says nothing about how long money took to come in once it did. A dollar collected after three weeks and a dollar collected after eight months count the same in the formula. There's a write-off ambiguity too: CEI may not distinguish cleanly between receivables that were genuinely collected and balances that got written off as bad debt. A company aggressively writing off bad accounts can show an improving CEI while actually losing more cash, since the formula doesn't separate "collected" from "no longer counted."
CEI is also backward-looking. It reports what happened during the period, but it doesn't predict which current invoices are at risk of going bad next. It only covers credit transactions, which matters for any business with a meaningful share of cash sales in the mix. And short measurement windows can distort the reading, so CEI tends to get more reliable the closer a company gets to a full year of data. Paidnice sums up the ceiling on all of this cleanly: "CEI is a strong score but it is not the whole story."
Reading DSO and CEI together
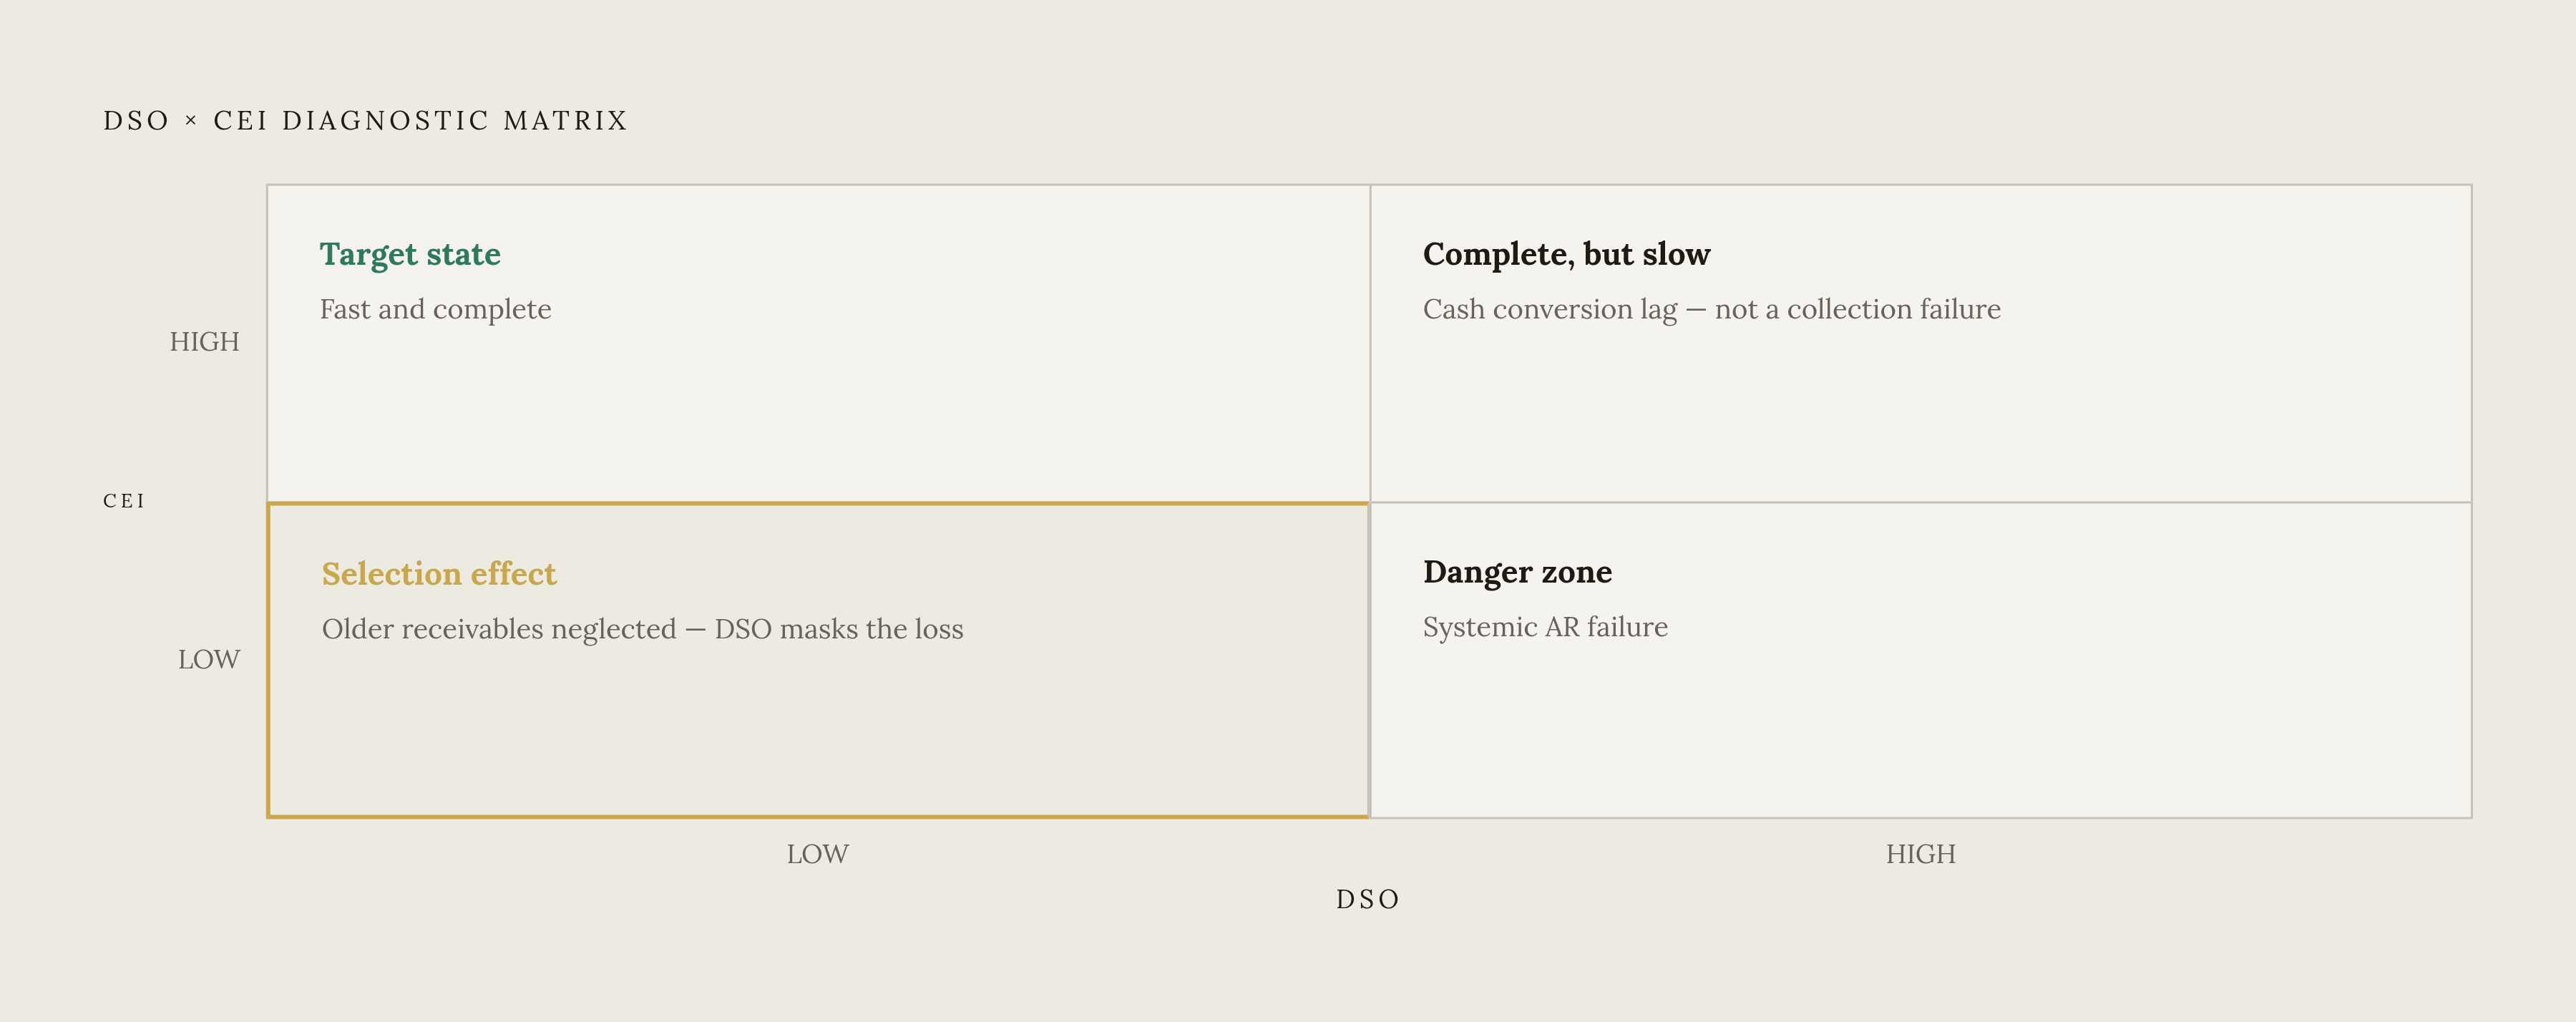
DSO and CEI together say more than either one says alone, and the combination a finance leader lands in, not any single number from either metric, is what actually reveals whether the AR function is working.
Four combinations cover the possibilities. High DSO paired with high CEI means collections are complete but slow, a cash conversion lag rather than a collection failure, worth investigating through payment terms or customer mix rather than through the collections team. Low DSO paired with high CEI is the target state: fast and complete, a genuinely healthy process. Low DSO paired with low CEI is a selection effect in disguise, fast on recent invoices while older or more complex receivables get neglected or slide toward uncollectible, exactly the pattern the research brief describes. High DSO paired with low CEI is the danger zone: slow and incomplete at the same time, a sign of systemic AR failure rather than one isolated weak spot.
The contrast matters in practice, not just on a chart. A company with a low DSO but a weak CEI is losing cash. A company with a somewhat higher DSO but a strong CEI is simply slow. Those are not the same problem, and they don't call for the same fix, even though a dashboard that only shows DSO would make them look identical. As a general rule, DSO and CEI should move in opposite directions when collection efforts genuinely improve. If they move together, or diverge in some unexpected way, something unusual is happening, maybe write-offs, maybe a revenue irregularity, and that's the signal to pull in a third number. Average Days Delinquent, DSO minus Best Possible DSO, isolates how many days beyond terms invoices are actually sitting, and it resolves the ambiguity when DSO and CEI start sending mixed signals.
Choosing DSO or CEI as Your Primary Metric
The right metric to lead with follows the question being asked, not whichever number happens to be on the dashboard already. DSO belongs at the center of benchmarking and cost-of-capital conversations. CEI belongs at the center of team performance reviews and internal process work.
DSO is the right lead metric in a few clear situations: comparing AR performance against industry peers or published benchmarks, since DSO is the common currency everyone outside the company already understands; estimating the carrying cost of outstanding receivables, since DSO translates directly into capital tied up per day; communicating AR health to investors or lenders who expect to see a conventional metric; and tracking performance against stated payment terms.
CEI is the right lead metric when evaluating what the collections team actually accomplished against what was realistically achievable, which makes it a fairer basis for compensation and performance review than a metric that DSO can swing just because sales had a strong quarter. CEI also works better for diagnosing whether collections are holding up during a period of rapid revenue growth, when DSO is going to fluctuate no matter how well the team performs. It's the better tool for telling apart a systemic process failure from a customer-mix issue, and it's the right choice for setting internal improvement targets that don't depend on how the rest of the industry is doing.
Which measurement is better depends entirely on what an organization is trying to measure, and that's a routing question, not a tie to be broken. Fast-growing companies in particular get more out of leading with CEI, since a revenue spike will reliably push DSO upward and make collections look worse than they actually are.
Moving CEI consistently toward 90% and above
Moving CEI upward isn't a one-lever fix. It takes a reminder cadence that actually runs on schedule, less friction in how customers pay, disputes that get resolved quickly instead of sitting open, and a systematic way of deciding which accounts to prioritize when the team's attention is limited. Organizations that automate those four pieces tend to see both CEI and DSO move in the right direction at the same time, since fixing the operational friction behind a weak CEI also tends to shave days off the collection cycle that DSO measures. The two metrics point at different problems, but the fixes overlap more than the formulas would suggest.